Section 4 -- Impact Overview
The normal way of measuring the effectiveness of an expenditure or investment in a potential project is to look and what you get for your money. Traditionally, it was measured in hard cash, how much money will it cost and how much money will I get back, as savings or returns. Return on Investment, or ROI. Slowly the equation definition has expanded to include other benefits, not just hard cash. Soft benefits were also included. Those soft benefits, which could be anything from safety to additional jobs created, are translated into monetary terms to allow the equation to function. A road job (Road Investment Strategy) with a ratio of 5.7 is more likely to get funding than one with a ratio of 2.0.
Value for Money (VfM)
DfT classifies any investment as having very high VfM if the Benefit Cost Ratio (BCR) is greater than 4.0, high VfM if the BCR is between 2.0 and 4.0 and medium VfM if the BCR is between 1.5 and 2.0. Low VfM is represented by a BCR between 1.0 and 1.5 and poor VfM occurs if the BCR is less than 1.0. For projects with a very high and high VfM classification there is a very strong investment case.
In terms of the environment, the measurement tends to be referred to as the Environmental Impact of a Project or Activity. Again, as a narrow criteria, a lot of projects have a negative impact on the environment. Trees have to be felled, or newts moved. However, if you take in all the factors, the overall impact may be positive, justifying the smaller loss for the greater gain. HS2 is an example of this.
Accordingly, this section refers to impact as apposed to Cost Benefit or Value for Money, but it deals with the same issues. Is it worth spending my money on … to reduce my homes carbon footprint.
Cost Benefit Analysis
Cost Benefit Analysis
Normally a project goes through some stages and at each stage there should be some form of Cost Benefit Analysis before going to the next stage.
You can either take that at face value and move on or click to expand a quick course on Project Management. I have been involved in Projects of one type or another for most of my career, so it could be a tedious off topic diatribe or quite informative, depending on your perspective.
Project Controls Overview
Lifecycle
Below is a extract from some documentation on the Association for Project Management website, a Guide to Lifecycle Models.
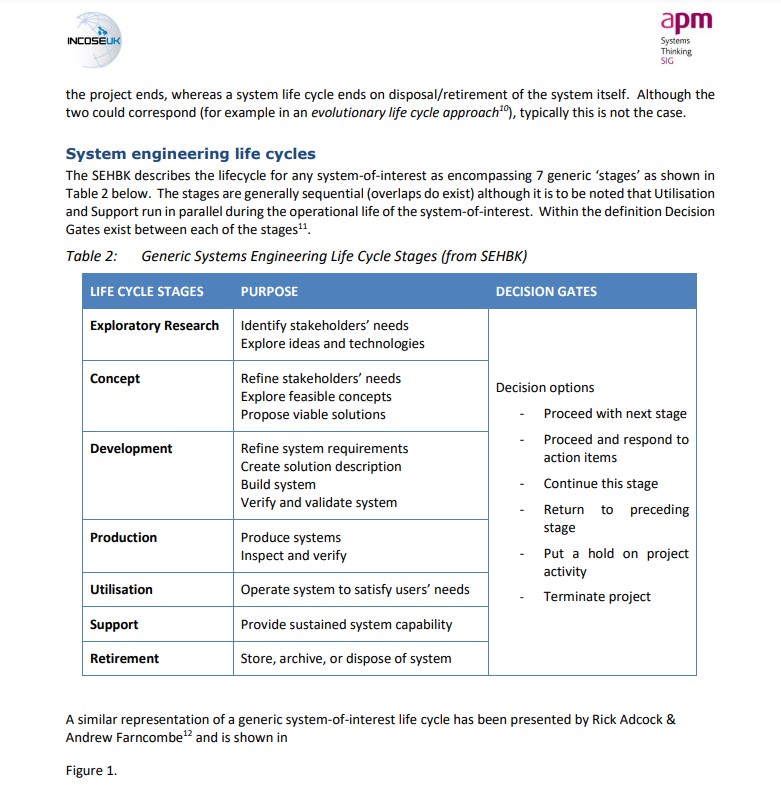
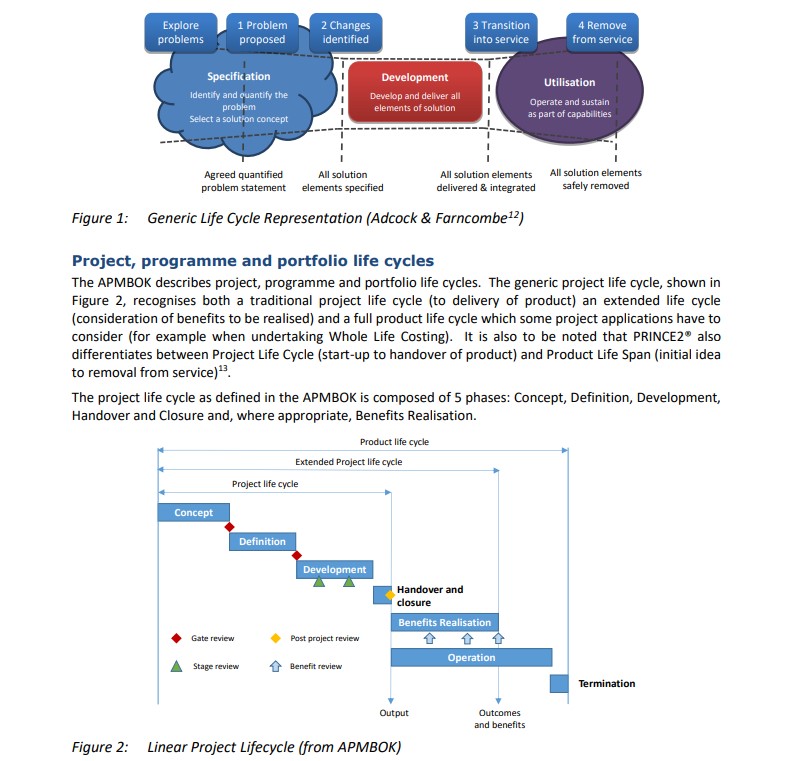
Just the start of a collection of different models.
When I started my career in Construction on Roads and Bridges, I was working for a Contractor. Stages were simple, Construction and Commissioning. The Projects were executed under a Civil Engineering Contract which allowed for a Certificate of Substantial Completion, which triggers the start of the defects liability period. and a Certificate of Final Completion. When the contract administrator considers all the items on the schedule of defects have been rectified, they issue a certificate of making good defects.
At the end of the defects liability period, the contract administrator prepares a schedule of defects, listing those defects that have not yet been rectified, and agrees with the contractor the date by which they will be rectified. The contractor must in any event rectify them within a reasonable time.
When the contract administrator considers all the items on the schedule of defects have been rectified, they issue a certificate of making good defects.
This has the effect of releasing the remainder of any retention and results in the final certificate being issued.
Building and Civil Engineering contracts are different.
Moving forward, I encountered Design and Build, or Design and Construct Contracts, which adds another element to the mix, making the Stages Detailed Design, Construction, and Commissioning.
I was aware of DBO Contracts, Design Build and Operate and BOOT Contracts, Build, Own, Operate and Transfer.
Working with Client side and Consultant I saw the whole range of Stages. Pre-Feasibility, Feasibility, Design, Design Development, Construction, Commissioning, together with Operate, Maintain, and Demolish.
Between each of the first four stages, i.e. before entering into a Contract which commits to the construction of the Project, there should be stage gates where the Cost Benefit Analysis is reassessed. Are the anticipated benefits still the same? What is the revised anticipated cost now that more is known about the Project and the associated risks. Risk Management is an important part of the evaluation? Is there a positive Return on Investment, and is it sufficient bearing in mind all the complexities of the Project?
Understanding the benefits fully is as important as having a good estimate.
System
Over time it became apparent that Projects were becoming more complex, especially in Railway Infrastructure. The Civils Designer and Signalling Designer need to work together to produce a product that functions as well as it should and could. Civils and Signalling was just an example, there are many other disciplines to add to the list.
When you think about it even a relatively simple road job has a number of design disciplines, even if they are all done by a single specialist roads designer. The object of the project, a new road, is a system. A new factory is a system. A railway is a system.
Hence if you look at a project as a whole system, with various disciplines required to achieve the required outcome, and those disciplines should be integrated to form the whole, much better outcomes can be achieved.
Further, road a rail systems also have to integrate with the remaining network, to function correctly.
System Engineering helps fulfil the holistic system approach.
A useful definition of System Engineering, reproduced in part below, can be found at INCOSE - International Council on Systems Engineering
Systems Engineering is a transdisciplinary and integrative approach to enable the successful realization, use, and retirement of engineered systems, using systems principles and concepts, and scientific, technological, and management methods.
We use the terms “engineering” and “engineered” in their widest sense: “the action of working artfully to bring something about”. “Engineered systems” may be composed of any or all of people, products, services, information, processes, and natural elements.
Systems Engineering focuses on:
- establishing, balancing and integrating stakeholders’ goals, purpose and success criteria, and defining actual or anticipated customer needs, operational concept and required functionality, starting early in the development cycle;
- establishing an appropriate lifecycle model, process approach and governance structures, considering the levels of complexity, uncertainty, change, and variety;
- generating and evaluating alternative solution concepts and architectures;
- baselining and modelling requirements and selected solution architecture for each phase of the endeavour;
- performing design synthesis and system verification and validation;
- while considering both the problem and solution domains, taking into account necessary enabling systems and services, identifying the role that the parts and the relationships between the parts play with respect to the overall behaviour and performance of the system, and determining how to balance all of these factors to achieve a satisfactory outcome.
Systems Engineering provides facilitation, guidance and leadership to integrate the relevant disciplines and specialty groups into a cohesive effort, forming an appropriately structured development process that proceeds from concept to production, operation, evolution and eventual disposal.
Systems Engineering considers both the business and the technical needs of customers with the goal of providing a quality solution that meets the needs of users and other stakeholders, is fit for the intended purpose in real-world operation, and avoids or minimizes adverse unintended consequences.
The goal of all Systems Engineering activities is to manage risk, including the risk of not delivering what the customer wants and needs, the risk of late delivery, the risk of excess cost, and the risk of negative unintended consequences. One measure of utility of Systems Engineering activities is the degree to which such risk is reduced. Conversely, a measure of acceptability of absence of a System Engineering activity is the level of excess risk incurred as a result.
Requirements Management
Similarly, Requirements Management helps deliver the projects objectives. Right from the light bulb moment when a project is born, it starts to have requirements. Frequently those early requirements are not captured and managed within the Requirements Management process, but they should be. Again, take the example of a new road. So the road is the primary requirement. No, it is not. The actual requirement may be to provide cleaner air to a community by reliving congestion on an existing road. Ways of achieving this could be to ban cars and lorries entirely or on alternate days. Another could be to charge a toll, which would be expensive enough to persuade most to take an alternative route. Designing and building a new road is therefore a solution of choice to resolve a problem. This therefore becomes the next level of requirement.
What sort of new road is the next question. The current traffic flow on the old road is a good starting point, both in terms of number or volume, and of type or mix. Heavy trucks, light vans, or mainly light cars. Then extrapolate the current to the future. What future? How long should the road last before being reconfigured or replaced. That duration will become a requirement, it is a factor in what the client wants and needs. How much draw will the new road have? How much additional traffic will the new road pull from existing routes? All of that will provide the capacity. Another requirement. Safety, visibility, potential weather conditions, land take, geography and geology are all examples of further requirements within the hierarchy.
Once a clear understating of the Project objectives are, based on the requirements, an outline estimate can be produced. Together with an outline benefits analysis.
At this time a comparison can be made between the perceived benefits and the probable cost of achieving those objectives. Does that represent good value for money?
Stage Gates
Continuing on from the life cycle of a Project and the natural breaks therein. At the end of each of those stages leading up to construction, the project should have a full health review including the development of the programme, system and requirements as well as of course the cost and benefits. Risk Management and Value Engineering outputs should also be assessed. Just to be clear, Value Engineering is often miss understood and misused to achieve cost cutting, without understating the basic function/cost equation, this should not happen.
Sometimes risks are understated to bring a project within budget, just to move it forward. I had one client tell me to reduce the risk so that he could get the project approved by the Board. He would then accept the Project Cost overrun during construction. That is not appropriate. I did not change the figures.
If all is well and the project is healthy in all respects, having met all the criteria for that particular stage, then, and only then should the stage gate be opened, and the project allowed to proceed to the next stage.
Generally, Stage Gate reviews are internal, with Senior Managers, but sometimes they are external, perhaps with Government bodies.
Either way, no key to the gate, means go back and review, and amend or complete. Try again next time. Or in rare cases, the project is cancelled, and funding pulled.
Whole life costing
Whole life costing, is precisely what it says on the tin.
You can't build a road at half the required thickness for the required capacity, only to have it last a quarter as long. Unless, of course, replacing the road four times as often was cheaper than building it once at the required depth, including the economic cost of four times the disruption. Or otherwise build it poorly, as maintenance and demolition are included in the whole life equation.
This premise alows for better design and construction with greater cost, offset against better performance and cheaper operation and maintenance. However, better construction may result in higher demolition costs as well, but both the duration of construction, and that of demolition are normally dwarfed by the operational period.
On one occasion, we priced for a bridge to be build using weathering steel. this was a significantly more expensive option. However, as it did not need painting, the railway beneath it did not need to be closed to paint the overhead bridge. This had safety implications as well as maintenance cost savings. No requirement for somebody to hang off the edge of a bridge to paint it, and no need to disrupt services whilst doing so. The whole life balance was in the favour of the greater construction cost.
This is a much more holistic view than just looking at the cost of construction.
Whole life lifecycle
Continuing on the theme of whole life, the lifecycle can then be distilled into four distinct phases, with multiple stages within each.
- Preparation,
- Implementation or Construction,
- Operation and maintenance, and
- Disposal, demolition, or remodelling
The project then becomes part of Asset Management, which engenders further holistic thought and processes.
The design then has to consider not only how to build it, but also how to maintain and dispose of it at the end of its usefulness, as well of course how it fulfils the requirements of the operational brief, and how it as a system integrates with the wider system surrounding it.
Continuing with the Asset Management theme, below is a 11 minute auto play presentation, which Ian Gordan and I developed many years ago which became known as Ivan's Process. I subsequently added BIM and BIG Data as I became involved in those. It does have a mention of imbedded carbon, but I suspect if I were still using this presentation, there would be greater emphasis on carbon and environment. Data, both structured and un-structured is immensely important in how we lead our lives today.
I think that should be the end of the very quick run through.
Cost Benefit is also known as Benefit Cost Ratio. The latter puts the words in the same order as the formula, but it is the same process. What will be the Benefits that I get out of spending the money, Cost.
Sometimes the straight cash only Cost Benefit Analysis gives a very poor return, but adding safety, deaths avoided, economic benefits, environmental benefits, social benefits, and reputational benefits, can change a poor investment into an essential investment.
For this exercise I will not be applying the strict investment rules, but a looser, perhaps set of guidelines.
Some projects will be done just because I want to, with no reference to Cost Benefit Analysis at all. Such as the Greywater Recycling and the Smart Home.
Whilst other projects will be rejected because the potential payback period is excessive, otherwise said as the positive impact is to small to be worth the effort and expense, unless it contributes to a larger gain when used to facilitate another project.
The Cost Benefit Analysis can also help to provide the correct order of doing projects, with those with the greatest impact done first. However, that is not the only parameter for deciding the order.
Go back to the top of this tab in this section
Go to the next tab in this section
Strategic Resilience
Strategic Energy Resilience
One of my past titles at work was 'Programme BIM Strategist for Network Rail Western and Wales.' I have written a number of Strategies for various clients.
Let us consider a farmer who has Tesco as a customer. There are other supermarkets. The farmer has the opportunity to increase the amount he sells to Tesco, at a slightly higher price, and with less effort, than he currently gets with his other existing customers.
Should he except the offer?
At a later date, Tesco offer an excusive deal for all his production, but at a slightly lower price.
Should he except new the offer?
A quick aside before continuing this scenario, and a little thought about something quite topical. Was it a good strategic decision to allow Russia to become so dominant in the supply of Gas to Europe?
A little history as well. England's largest forest, Kielder. The first plantings at Kielder were in 1926 when 800 hectares (3 sq mi) of coniferous trees were planted. A further 19,000 hectares (73 sq mi) were purchased in 1932 and today 62,000 hectares (239 sq mi) of forest are under Forestry Commission control. The Forestry Commission, funded from the public purse, purchased land across the country with the brief of establishing a strategic reserve of timber for the nation. This single objective held sway until the 1960s. Since that time, management principles have changed in order to reflect rising awareness of environmental needs and to provide recreational facilities whilst seeking to maintain a sustainable supply of timber. The Forestry Commission was set up in 1919 to expand Britain's forests and woodland after depletion during the First World War.
It was a strategic decision to set up the Forestry Commission not an economic or political one.
So, back to our farmer, tempted with initially higher profits.
From a strategic point of view, is it wise to only have one supplier or customer? 'All your eggs in one basket'?
What would happen to the farmer and his business should something significant change with his relationship with Tesco's. Either a reduction of price or withdrawal as a customer could have a devastating impact on the farmer.
This was just one hypothetical example, with no significance of using Tesco in the example. The same applies to many other supermarkets, and indeed many other industries. There have been examples of catastrophic supply chain failures, demonstrating a lack of resilience.
How does resilience effect energy?
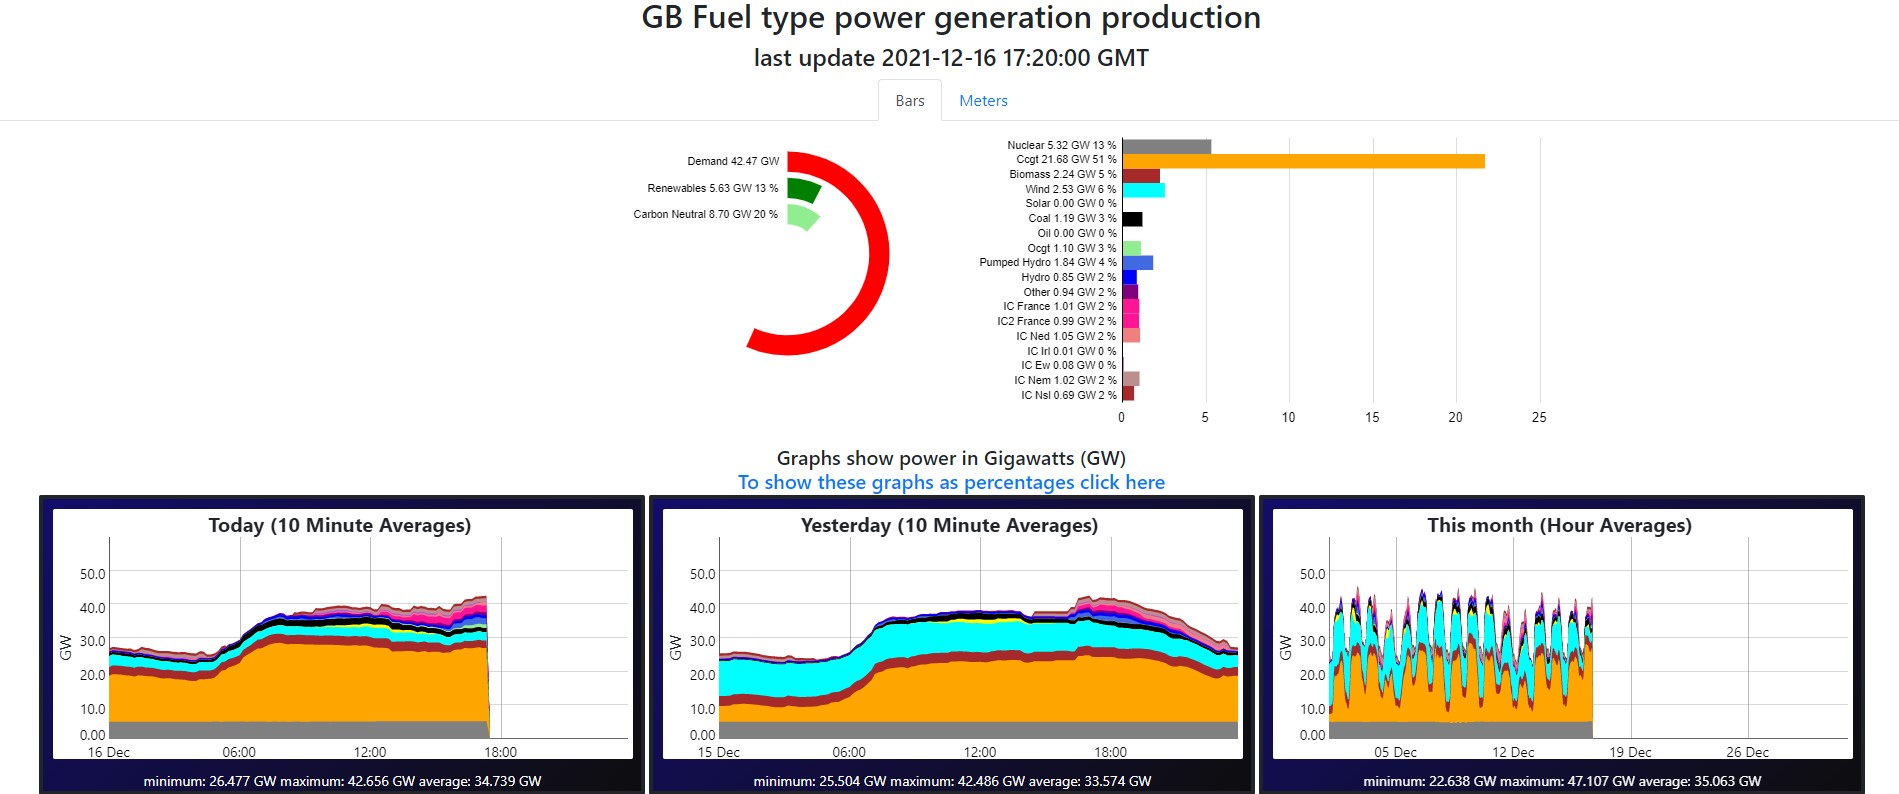 There is an informative site called GridWatch. Yesterday, at time of writing, GB electricity use from all sources was; minimum: 25.504 GW maximum: 42.486 GW average: 33.574 GW
There are pages for CO2 output and Power Grid Frequency in addition to the Fuel type power generation.
Click the GridWatch link to see the information in more detail.
You will be able to notice that CCGT Combined Cycle Gas Turbine, has the largest proportion of the mix of fuels. Partly driven by the 'Dash for Gas' following the North Sea Oil finds.
The meters below, otherwise known as widgets, connect to the data in near real-time. Refresh the page to see the latest readings.
The Coal Strategy
During the 1940s some 90% of the generating capacity was fired by coal, with oil providing most of the remainder.
While more than 1,000 collieries were working in the UK during the first half of the 20th century, by 1984 only 173 were still operating and employment had dropped from its peak of 1 million in 1922, down to 231,000 for the decade to 1982.
Competition from cheap oil imports arrived in the late 1950s and the coal industry began to suffer from increasing losses. In 1960 Alf Robens became the chairman of the National Coal Board (NCB), and he introduced a policy concentrating on the most productive pits. During his ten-year tenure, productivity increased by 70%, but with far fewer pits and a much reduced workforce. In 1956, 700,000 men produced 207 million tons of coal; by 1971, fewer than 290,000 workers were producing 133 million tons at 292 collieries. Despite this, the NCB's coal activities were still running at a loss in 1970, putting pressure on the board to hold down pay increases.
I should point out that not all coal mined goes to electricity generation. There are other uses, including steel production.
The 1972 UK miners' strike was a major dispute over pay between the National Union of Mineworkers (NUM) and the Conservative Edward Heath government of the United Kingdom. Miners' wages had not kept pace with those of other industrial workers since 1960. The strike began on 9 January 1972 and ended on 28 February 1972, when the miners returned to work.
The strike was characterised by the miners sending flying pickets to other industrial sites to persuade other workers to strike in solidarity, which led to railway workers' refusing to transport coal and power station workers' refusing to handle coal. Power shortages emerged, and a state of emergency was declared on 9 February 1972, after the weather had turned cold unexpectedly and voltage had been reduced across the entire national grid.
The Three-Day Week was one of several measures introduced in the United Kingdom in 1973-1974 by the Conservative government at the time to conserve electricity, the generation of which was severely restricted owing to industrial action by coal miners and railway workers.
In the 1970s, most of the UK's electricity was produced by coal-burning power stations. To reduce electricity consumption, and thus conserve coal stocks, the Conservative Prime Minister, Edward Heath, announced a number of measures under the Fuel and Electricity (Control) Act 1973 on 13 December 1973, including the Three-Day Work Order, which came into force at midnight on 31 December. Commercial consumption of electricity would be limited to three consecutive days each week. Heath's objectives were business continuity and survival and to avoid further inflation and a currency crisis. Rather than risk a total shutdown, working time was reduced to prolong the life of available fuel stocks. Television broadcasts were to shut down at 22:30 each evening, and most pubs were closed; due to the power surges generated at 22:30, the Central Electricity Generating Board argued for a staggered shutdown on BBC and ITV, alternating nightly, and this was eventually introduced. The television broadcasting restrictions were introduced on 17 December 1973, suspended for the Christmas and New Year period, and lifted on 8 February 1974.
On 24 January 1974, 81% of NUM members voted to strike, having rejected the offer of a 16.5% pay rise.
The strike began officially on 5 February and, two days later, Heath called the February 1974 general election while the Three-Day Week was in force. His government emphasised the pay dispute with the miners and used the slogan "Who governs Britain?". Heath believed that the public sided with the Conservatives on the issues of strikes and union power.
On 21 February 1974, the government's Pay Board reported that the NUM's pay claim was within the Phase 3 system for claims and would return miners' wages to the levels recommended by the Wilberforce Enquiry in 1972.
The election resulted in a hung parliament: the Conservative Party took the largest share of the vote, but lost its majority, with Labour having the most seats in the House of Commons. In the ensuing talks, Heath failed to secure enough parliamentary support from Liberal and Ulster Unionist MPs; and Harold Wilson returned to power in a minority government. The normal working week was restored on 8 March, but other restrictions on the use of electricity remained in force. A second general election was held in October 1974 cementing the Labour administration, which gained a majority of three seats.
The new Labour government increased miners' wages by 35% immediately after the February 1974 election. In February 1975, a further increase of 35% was achieved without any industrial action.
The miners' strike of 1984–1985 was a major industrial action to shut down the British coal industry in an attempt to prevent colliery closures.
The NUM's strike in 1974 played a major role in bringing down Edward Heath's Conservative government. The party's response was the Ridley Plan, an internal report that was leaked to The Economist magazine and appeared in its 27 May 1978 issue. Ridley described how a future Conservative government could resist and defeat a major strike in a nationalised industry. In Ridley's opinion, trade union power in the UK was interfering with market forces, pushing up inflation, and the unions' undue political power had to be curbed to restore the UK's economy.
Prime Minister Thatcher expected Scargill to force a confrontation, and in response she set up a defence in depth. She believed that the excessive costs of increasingly inefficient collieries had to end in order to grow the economy. She planned to close inefficient pits and depend more on imported coal, oil, gas and nuclear. She appointed hardliners to key positions, set up a high level planning committee, and allocated funds from the highly profitable electrical supply system to stockpile at least six months’ worth of coal.
In 1983, Thatcher had appointed Ian MacGregor to head the National Coal Board. He had turned the British Steel Corporation from one of the least efficient steel-makers in Europe to one of the most efficient, bringing the company into near profit. Success was achieved at the expense of halving the workforce in two years and he had overseen a 14-week national strike in 1980. His tough reputation raised expectations that coal jobs would be cut on a similar scale and confrontations between MacGregor and Scargill seemed inevitable.
My interpretation
I think that is sufficient to paint the background. From the 1950's UK coal mining had become increasingly inefficient and expensive. The strength of the unions controlled the issues and sustained the problems for years beyond a natural decline. Part of that power was due to, if not 'all the eggs in one basket', most of them. The unions had so much power they were damaging the country and arguably brought down the Government. Over time the Government developed a strategy to be more resilient, both in terms of power diversity and stockpiling. The next time the miners went on strike, they lost, and they struck the death knell for the majority of the UK coal industry. The opposite of what they were fighting for!
The Wilberforce Report may have concluded the correct level of remuneration for the work, conditions, and risks associated with coal mining, but the end product was not worth the cost of extracting it from the ground. At one time one could have argued the strategic importance of power self-sufficiency, but along came North Sea Oil.
Offshore production, like that of the North Sea, became more economical after the 1973 oil crisis caused the world oil price to quadruple, followed by the 1979 oil crisis, causing another tripling in the oil price.
Consider the situation at the beginning of this example, almost total reliance on coal for the generation of electricity, and compare that to the diversified and varied snapshot of GB Fuel type power generation production above.
Another source of similar data, including further graphics.
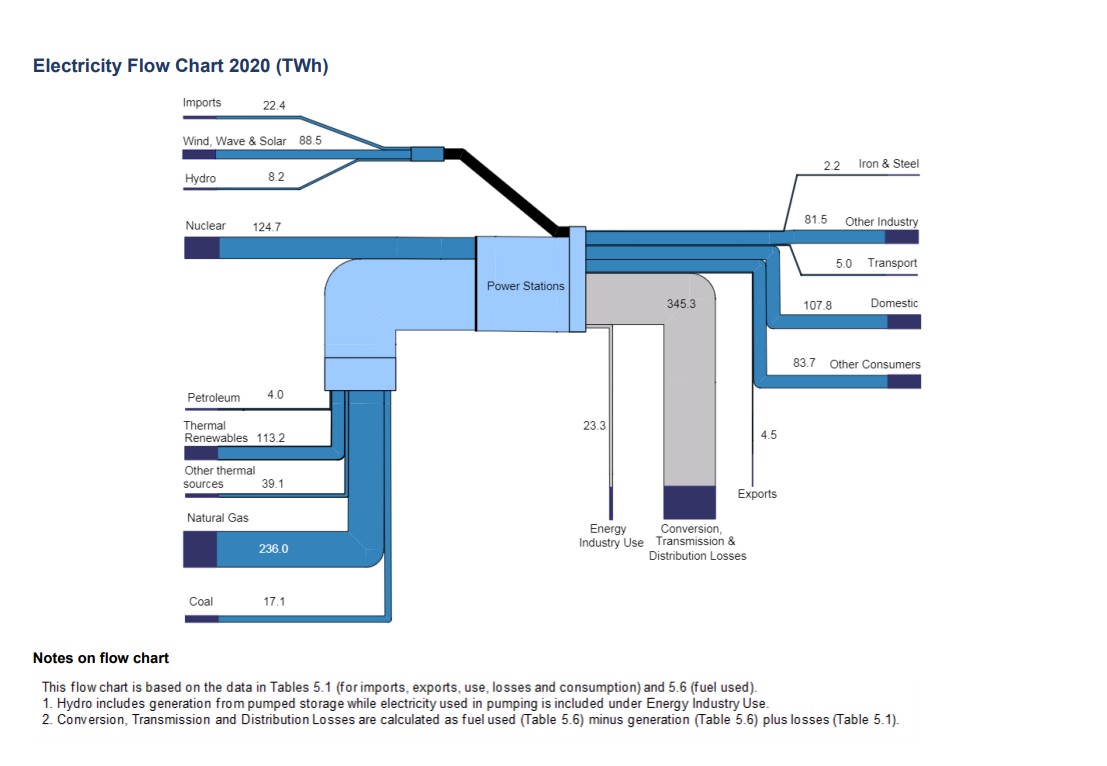
A Government source of data can be found at 'DUKES chapter 5: statistics on electricity from generation through to sales.' Including this DUKES 2021 Report, of which the image below is part. It further indicates the diversification of fuel sources.
What is the relevance to Homes?
Possibly an interesting discussion about national Strategic Resilience, although successive governments, of any rosette colour, seem to have forgotten, or put aside, any thought about Strategic Resilience Planning, but what is the relevance to my home, or homes in general.
Storm Arwen leaves 30,000 homes without power five days on from lashing UK.
Energy suppliers have said 30,000 homes remain without power following the damage caused by Storm Arwen, after thousands of people spent a fifth night without electricity.
It will be at least the end of the week – seven days after the devastating storm – before electricity is restored to some, the Energy Networks Association (ENA) has warned.
...
"Clearly, Storm Arwen was an event the likes of which we haven’t seen for certainly 60 years since the record starts."
“We have to be prepared for similarly extreme difficult weather conditions in the future. We have to make sure that our system is resilient in that eventuality.”
Some people were without heating, hot water, hot food or drinks, in their own homes for days, perhaps a week. The gas boiler needs electricity to run the pump. Electric hobs instead of gas, no ability to heat food or water. No lights. Cold and difficult days and long and even colder nights, in freezing conditions.
Extreme weather events are becoming more extreme and more frequent.
Electricity generation may be more diverse and not as susceptible to the unions and strikes, but what about overall capacity, the looming Energy Gap.
A report from the industry in 2005 forecast that, without action to fill the gap, there would be a 20% shortfall in electricity generation capacity by 2015. Similar concerns were raised by a report published in 2000 by the Royal Commission on Environmental Pollution (Energy - The Changing Climate). The 2006 Energy Review attracted considerable press coverage - in particular in relation to the prospect of constructing a new generation of nuclear power stations, in order to prevent the rise in carbon dioxide emissions that would arise if other conventional power stations were to be built.
Energy gap disappears
However, due to reducing demand in the late-2000s recession removing any medium term gap, and high gas prices, in 2011 and 2012 over 2 GW of older, less efficient, gas generation plant was mothballed. In 2011 electricity demand dropped 4%, and about 6.5 GW of additional gas-fired capacity is being added over 2011 and 2012. Early in 2012 the reserve margin stood at the high level of 32%.
Another important factor in reduced electrical demand in recent years has come from the phasing out of incandescent light bulbs and a switch to compact fluorescent and LED lighting. Research by the University of Oxford has shown that the average annual electrical consumption for lighting in a UK home fell from 720 kWh in 1997 to 508 kWh in 2012. Between 2007 and 2015, the UK's peak electrical demand fell from 61.5 GW to 52.7.GW.
In June 2013, the industry regulator Ofgem warned that the UK's energy sector faced "unprecedented challenges" and that "spare electricity power production capacity could fall to 2% by 2015, increasing the risk of blackouts". Proposed solutions "could include negotiating with major power users for them to reduce demand during peak times in return for payment".
The use of electricity declined 9% from 2010 to 2017, attributed largely to a decline in industrial activity and a switch to more energy efficient lighting and appliances. By 2018 per capita electrical generation had fallen to the same level as in 1984.
The impact of the UK's COVID-19 lockdowns on energy demand and emissions.
Around the world, efforts to contain the COVID-19 pandemic have profoundly changed human activity, which may have improved air quality and reduced greenhouse gas emissions. We investigated the impact of the pandemic on energy demand and subsequent emissions from electricity and gas throughout 2020 in the UK. The daily pattern of electricity demand changed in both lockdowns, with weekday demand shifting to that of a typical pre-pandemic weekend. Energy demand in 2020 was modelled to reveal the impact of the weather and the pandemic. The first lockdown reduced demand by 15.6% for electricity and 12.0% for commercial gas, whereas the second lockdown produced reductions less than half. Domestic gas demand did not change during the first lockdown, but increased by 6.1% in the second, likely due to increased domestic heat demand. The changes in demand for gas resulted in little change to overall gas consumption emissions during the pandemic. For electricity, large emission reductions occurred during the two lockdowns: up to 22% for CO2, 47% for NOx, and 29% for PM2.5.
So, it appears that the Energy Gap threat has dissipated, at least for now. However, Heat Pumps and eclectic cars may impact that situation.
Apparently, extreme weather maybe becoming more probable.
Strategy Energy Resilience for homes becomes, not about national decisions about fuels and unions, but about what energy sources you have in your home, and the provisions you make about how to cope when one of them is not available for an extended period. What are the probabilities of such an event and what are the consequences. How you will make a hot drink? Food? Warmth? How will you do almost anything, without electricity.
This consideration has to be part of the mix in informed decision making, not just return on investment or savings in carbon.
Go back to the top of this tab in this section
Go to the next tab in this section
Home as a System
The Home as a System
For a brief explanation of 'System' in this context, Go back to the Cost Benefit Analysis section, within the Project Controls section
A home is a collection of hopefully integrated systems to create a overall system which functions in the way we want our home to be.
The first system to my mind, is the fabric, shall we say System A.
- Foundation
- External Walls
- Internal Walls
- External Doors
- Internal Doors
- Windows
- Roof
- Gutters and downpipes
The next is a collection of systems which fit within the fabric, called services, System B
- Mains Water
- Water Tank and Gravity fed water supply
- Domestic hot water
- Foul water drainage
- Surface water drainage
- Heating fuel supply
- Cooking fuel supply
- Electrical distribution and power circuits
- Electrical distribution and lighting circuits
- Heating circuits
- Ventilation
- Waste disposal
The next is predominantly fixed mechanical plant, System C
- Heat generation (Boiler)
- DHW generation (Boiler / Water heater)
- Air conditioning
- Forced ventilation / Heat Recovery Ventilation
- DHW Cylinder
- Cooker
- Hob
- Fridge and Freezer
- Washing and drying (clothes)
- Washing and drying (Crockery and cutlery)
The next in some instances is the Smart Home and in others just controls, System D
- Central heating programmer and thermostat
- DHW programmer and thermostat
- Smart Home voice assistant
- Smart Home lighting
- Smart Home Smoke and Gas detectors
- Smart Home Intruder Alarms
- Smart Home CCTV
The next may be in some homes, Energy generation or harvesting, System E
- Rainwater harvesting and storage
- Greywater harvesting, processing and storage
- Harvested water distribution
- PV Solar panels and inverter
- Battery and Gateway
- Solar Thermal
- Waste disposal (On site)
Other lists would move into contents, which may or may not be considered systems
All of the above systems, those in use, need to integrate harmoniously to provide a holistic, efficient, green, home pleasant to live in.
The dilemma now is whether to organise the rest of this section in accordance with the system above or Generate, Refuse, Reduce, Reuse, Recycle, Repair, and Recover. From a work perspective it would probably be stick with the systems, however, for this purpose, lets see how it goes with GRRRRR.
Go back to the top of this tab in this section
Go to the next tab in this section
Heat Report
Hacks Heat Report Calculator
I wish I had found this earlier than I did. So it is out of sequence, but with good cause.
Below is a spreadsheet containing a download of of the Heat Report. I found the HACKS Heat Report Calculator and filled it in with the appropriate input.
What is HACKS?
Heating and Cooling Knowhow and Solutions (HACKS)
The objective of the project Heating and Cooling Knowhow and Solutions "HACKS" is to achieve market transformation for heating and cooling (HAC) appliances and improve comfort and health of consumers.
Across the EU and the UK, almost half of all buildings have individual boilers that were installed before 1992 with efficiency of 60% or less. The expected energy savings of a speedy replacement are immense.
To achieve this goal, 17 HACKS partners in 15 countries are working together, thanks to the financial support of the European Horizon 2020 programme.
After scanning market actors, current policies and most commonly used products in each country, from 2020 the HACKS partners will implement involvement campaigns to raise awareness of the economic and environmental benefits brought by good HAC products and solutions:
- HACKS will motivate households equipped with old and inefficient devices - boilers, water heaters, certain types of boilers and stoves, etc. - to replace them with new super-efficient equipment.
- In each country, partners will set up dedicated online platforms to assist consumers in their purchase process. The platforms will highlight: tools to assess households' needs and provide customised information, best product lists with technical specifications, direct links to suppliers of most efficient products, and advice on how to use and maintain equipment.
- For those households who need to improve their situation because they feel too hot, too cold, or too humid but who cannot invest in new equipment or can avoid getting equipped, HACKS will propose simple and low-cost solutions. It is possible to reduce energy consumption and energy bills while improving winter and summer comfort, air quality and health conditions through the installation of products such as shading devices, thermostats, water saving taps and showerheads.
Beyond households, HACKS will target all relevant stakeholders (“multipliers”) that participate in the decision-making process of consumers by setting up strategic partnerships to facilitate the purchase of energy efficient appliances. HACKS places a strong emphasis on installers but also retailers and consumer organisations because of their proximity to consumers, their capacity to involve them and bring them guidance on energy efficient equipment.
HACKS Calculator: your starting point to achieve an energy efficient home
Not sure on where to start on your energy efficiency journey? Don't worry, our online calculator is here to help. The calculator will ask you a series of questions about the energy set up at your home and determine the best solutions for you.
Well, unsurprisingly, I did not start on my energy efficiency journey here, but given the opportunity, I would have done. I provides a useful insight.
https://calculator.topten.eu/?country=uk
I did have the page here but the excel links no longer work, so it is better to go to the original page.
There is so much useful information in the report which helps make decisions about which projects have the most impact.
Go back to the top of this tab in this section
Go to the next tab in this section
Grrrrrr
Grrrrrr - Generate, refuse, reduce, reuse, repair, recover, recycle.
Repeating what was said in the introduction, and building upon it.
Picking up on recycling's Reduce, Reuse, Recycle, or 3Rs. Which has developed into Reduce, reuse, repair and recycle and then 5rs (Refuse, Reduce, Reuse, Repurpose, Recycle).
What are known as the famous 5 when it comes to managing waste?
Usually we put recycling on top of everything, but today on the 5 R process, it comes in last. Five actions should respectively be taken if possible before recycling any products. These R’s include: refuse, reduce, reuse, repurpose and finally, recycle. This is an important methodology for businesses to follow to ensure they can reduce waste and boost their recycling efforts. This ultimately lessens the amount of waste that will end up in landfill and will optimise your recycling programs.
I like to add a G to the front of the Rs. That becomes Grrrrrr, which is reasonably descriptive of the whole issue. By the way, the G is for Generate, or Generate your own. Whilst it is a steal from waste management it is not a bad fit for reducing ones carbon footprint.
However, there may be room to improve the fit. I am not sure how Repurpose comes into play in the Energy Equation. Perhaps we could read that as Repair and Recover, Although, Repair may be a difficult fit as well. Refuse is also a little difficult, but that can stay.
So the revised mantra is;-
Generate, Refuse, Reduce, Reuse, Repair, Recover, Recycle. Each of these will be discussed over time in the following associated tabs.
Of these the most significant are probably generate and reduce.
Go back to the top of this tab in this section
Go to the next tab in this section
Generate
Generate
Generate in this context is any form of local small scale energy production.
It’s possible to generate your own electricity or heat from renewable, or replenishable, sources of energy, such as the sun or wind.
You can find out more about renewable and low carbon heating options for your home.
Electricity generated at home can be used to power electrical appliances, or even an electric vehicle, reducing the amount of electricity you import and pay for from the grid.
This could help you save money on your electricity bills, as well as contribute to reducing the carbon emissions of the UK’s electricity network.
With over 1 million homes in the UK already generating electricity from either solar or wind, renewables are quickly becoming a common sight across the UK.
What type of renewable energy is right for me?
There are different technologies available, each with their own benefits and considerations. Our technology pages below can help guide you through the options for installing renewables in your home.
Alternatively, explore our advice pages on renewable and low carbon heating options.
There are four examples on the Energy Saving Trust website; Solar electricity panels, Wind turbines, micro hydroelectricity, and Micro combined heat and power.
- Solar electricity panels, also known as photovoltaics (PV), capture the sun’s energy and convert it into electricity that you can use in your home.
- Wind turbines harness the power of the wind and use it to generate electricity. When the wind blows, the blades are forced round, driving a turbine that generates electricity. The stronger the wind, the more electricity produced.
- Whether it’s from a small stream or a larger river, small or micro hydroelectricity systems, also called hydropower or hydro systems, can produce enough electricity for all electrical appliances and lighting in the average home.
- Micro combined heat and power (micro-CHP) is a technology that generates heat and electricity simultaneously, from the same energy source, in individual homes or buildings. The main output of a micro-CHP system is heat, with some electricity generation, at a typical ratio of about 6:1 for domestic appliances.
Of these, we had no difficulty in discounting micro hydroelectricity due to a lack of a suitable stream or river to harness power from. I do have a friend of a friend who has done the exactly that, and it seems very successful.
There is another form of renewable energy not listed on that page of the Energy Saving Page, as it does not generate electricity. It does however, generate heat. Solar Thermal, is discussed below.
Gen - Solar PV
Solar photovoltaics (PV)
I consider that the main form of home generation is Solar PV. However, it is not suitable for all. You have to have a roof in the first instance. Well not quite true, you could go for a ground installation, but that has its own difficulties. If you are living in a block of flats, it is unlikely that you will be able to fit PV panels to the roof.

Solar PV and Battery Impact
I have been watching the development of Solar photovoltaics (PV) for many years.
Initially as part of a design project for a all terrain expedition vehicle / motorhome. A roof predominantly covered with PV panels and a bank of 10 deep cycle batteries. I also went to a Caravan and Motorhome show and saw a PV panel mounted on a devise that looked like a satellite dish support, but instead of having a dish, it had a PV panel. It tracked the sun, to maximise power generation.
The Oyster SunMover System is an intelligent GPS controlled solar tracking system. It can automatically track the suns path throughout the day and adjust as necessary to maximise solar energy capture making it more efficient than standard fixed solar panels.
The system itself consists of a 75W solar panel attached to a specially designed electronic mechanism which is controlled internally via its own control system in the roof unit making installation simpler. On average the system is capable of harvesting approximately three times the power of a 75W fixed solar panel on its own. This is even more important in the winter months where the angle of insolation (the angle of the suns rays on the earth) is much greater i.e. the sun is effectively lower in the sky. The Oyster SunMover can adjust the elevation (the angle of the solar panel) to maximise energy harvest throughout the year.
This was a long time ago, and I can't remember if the make was Oyster or the price. However, at over £2000 before being discontinued, for just one panel, it was not directly pursued.
I did think about building a frame about 20 x 8 ft, which could elevate and swivel, so the roof could be covered with PV panels in drive mode, and then positioned for maximum benefit when parked. Turning it by hand every half an hour or so. Also. it could be two layers, so that in the right position, part could be an awning as well. Verdict, all to cumbersome. Human factors would indicate lack of use and leave it in the stowed position. Effectively flat to the roof, which is also safer as you don't have to worry about driving off with the rig up. Yes, I have seen the very unlikely event occur, with a tipper truck drove off with the back still up, struck a bridge and almost toppled over. Could have been even worse if it was power cables. Best avoided.
Go back to the top of this tab in this section
Go to the next tab in this section
Gen - Solar thermal
Gen - Wind Power
Gen - micro-CHP
Micro combined heat and power
Go back to the top of this tab in this section
Go to the next tab in this section
Refuse
5 Your text...
Go back to the top of this tab in this section
Go to the next tab in this section
Ref D5.1
Ref D5.2
D5
Reduce
6 Your text...
Go back to the top of this tab in this section
Go to the next tab in this section
Red - Control
6 Your text...
Go back to the top of this tab in this section
Go to the next tab in this section
Red - Control the heating
Red - Control DHW
Red Heat loss
6 Your text...
Go back to the top of this tab in this section
Go to the next tab in this section
Red D6.4
Red D6.5
Red D6.5
Red D6.5
Red Efficiency D6.5
6 Your text...
Go back to the top of this tab in this section
Go to the next tab in this section
Red D6.7
Red D6.7
Red D6.7