Section 3 -- The Problem
The problem is complex and many fold. However, understanding a problem is key to resolving it, or mitigating against it. There are many techniques available and that I am failure with, including root cause annalist and risk management. However, this problem is easier to describe than it is to solve.
Climate Change
Climate Change
At the risk of repeating myself ad nauseum, whilst I was at school several decades ago, I recall being taught at the time that the world is a fragile place and that if the ambient temperature rose by as little as 4oC it would result in a Mass Extinction Event, not that they were called that at the time. Nor the more recent term, Extinction Level Event. (ELE).
That figure of 4oC appears to have risen to 5.2oC or sometimes 6oC. I am not sure how much the latter figure is driven by the politics of providing hope for the future to avoid despair and anarchy, as we are sailing perilously close to exceeding the threshold. Better science or political will to not give all of the bad news at the first sitting, you can decide.
I will not however, try to explain Climate Change, the reasons for, or the problems caused here as there is plenty of better researched sources of information on the internet.
Suffice it to say that there will be more frequent extreme weather events, which have to be catered for in any decision making process regarding reducing the carbon footprint of a 1930's home. There will also be impacts on the financial implications of those decisions, including fuel cost, taxation, and product costs.
Climate Change also provides the main imperative for wanting to reduce the carbon footprint.
Go back to the top of this tab in this section
Go to the next tab in this section
Old housing stock
Old housing stock
The housing of the UK is the oldest in the world and is being replaced very slowly. As such, it presents unique challenges in making it fit for the future. Below are some global conclusions based on BRE’s experience of 50 years of housing conditions surveys:
- – Targeted policies can have a major effect on housing conditions and performance.
- – Housing improvements are generally one-way gains and will accrue benefits long into the future.
- – Housing repair and maintenance has to be sustained.
- – Tackling poor housing conditions does not have to be expensive and has multiple benefits to society as a whole.
- – It makes economic sense to invest in improving housing rather than pay for the consequences of poor housing through the NHS and other agencies.
- – If you provide sufficient good quality housing, everything else will follow, with proven gains in asset value, health, wellbeing, life chances and economic performance.
- – Build sub-standard housing and you are stuck with it and it will be very difficult to repair, improve or replace.
- – Finally, investments in national housing surveys will pay for themselves time again in well-informed, funded and targeted housing policies that will ultimately deliver social and economic benefits. All the better if these surveys have comparable methodologies and timeframes.
The above is an extract of the BRE Trust Report, the Housing Stock of the UK.

UK Housing Stock
The first port of call on this discussion is the BRE Trust Report, the Housing Stock of the UK.
Extracts
There is a regular call for statistics on the United Kingdom (UK) housing stock, usually to compare them with statistics of other European or world nations. This is, however, not straightforward, as they have to be compiled from the four separate housing surveys of England, Scotland, Wales and Northern Ireland. The four surveys are undertaken over different timescales, with different sampling criteria and survey instruments. Even questions that appear similar are often subtly different. Scotland and Wales do not include vacant dwellings whereas England and Northern Ireland do.
The first house condition survey in the world, using trained inspectors to visit a representative sample of the national housing stock, was undertaken in England and Wales in 1967. At the time, slum clearance was going ahead at pace and new housebuilding was at a historical high. There was a growing feeling that housing renewal should be based on more robust evidence. A sub-committee of the Central Housing Advisory Committee recommended in its 1966 report: ‘Our older homes – a call for action’ that: “a national survey, scientifically designed and carried out by skilled investigators, was necessary to provide reliable data on house condition”, and the survey was the outcome of this.
The survey method was very simple and consisted of a one-page form to be completed by specially trained Public Health Inspectors, Figure 1.1. It was based on a sample of 6,000 randomly selected homes across England and Wales. The results were reported in Economic Trends in 1968.They showed that the condition of the housing stock in England and Wales was worse than expected. There were 15.7 million homes in England and Wales in 1967. Some 40% of these were built before 1919; 25% lacked a basic amenity (bath, wash hand basin, hot water); 19% lacked an indoor WC; 7% were in potential clearance areas; 5% required repairs exceeding £1,000 (around £17,000 at 2017 costs, based on the RPI index, the most relevant index of those dating back to 1967).
The 1967 housing survey was very significant because it provided the evidence base for future housing policies. These included the targeting of slum clearance programmes, rather than the previous ‘scattergun’ approach, and the identification of areas for grant-aided improvement work. It also enabled limited resources for public expenditure on housing improvement to be distributed on a scientific basis.
While the survey methodologies have evolved slowly over the years to ensure comparability of measurement with both each other and what has gone before, improvements in technology have been more dramatic. Data is now collected in the field by surveyors using a paper/digital pen system in England, Scotland and Wales, while Northern Ireland uses tablet PCs. The technology has improved efficiency and data quality and speeded up the reporting process. Headline results from all surveys are published within a year of the end of the latest fieldwork period.
The purpose of these surveys has been to monitor housing supply, conditions, energy performance and fuel poverty, and to direct policies towards continued improvement. The initial problems of unfitness, disrepair and lack of basic amenities identified in the early surveys were targeted with substantial investment programmes in the 1970s and 1980s and have largely been eradicated. During the 1980s, over £1 billion of public money per annum was being spent on Private Sector Renewal, based on the results of the UK national housing surveys. Due to the serious problems identified through the surveys, Wales received a proportionately larger share of the available funding, Figure 1.3.
2.2 Age, type and size of dwellings in the UK
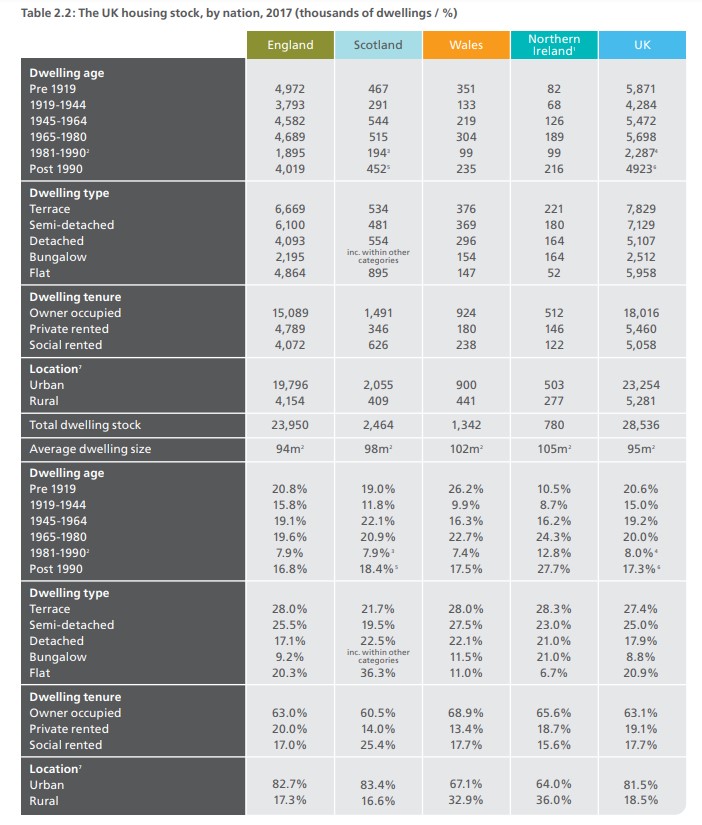
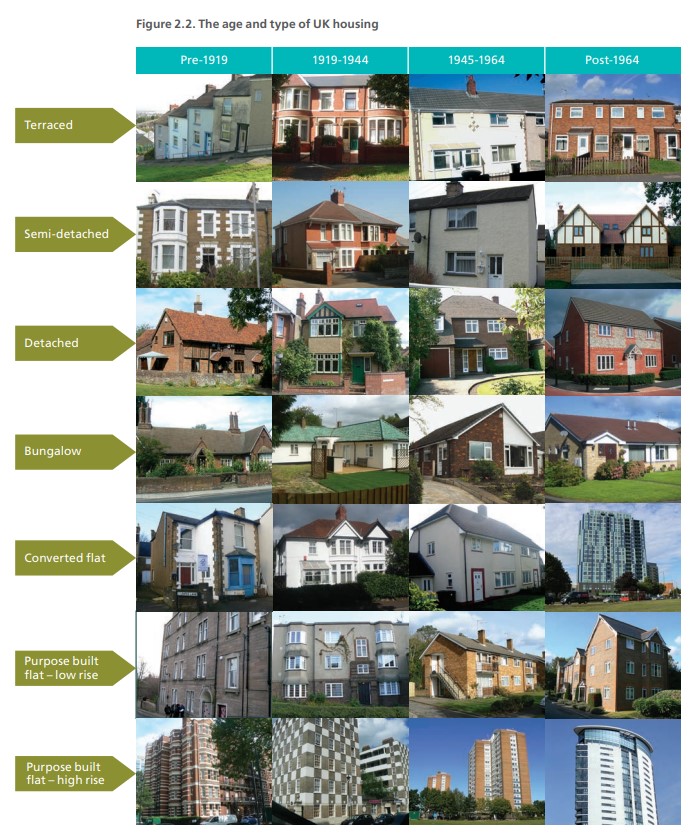 BRE The age and type of UK housing - Extract from BRE Trust Report, the Housing Stock of the UK.The housing stock of the United Kingdom is very diverse, representing a long history of housebuilding, local building preferences and materials, and policy interventions. Every dwelling type shown in Figure 2.2 is represented in each of the four UK nations but in differing proportions, Table 2.2
Dwelling construction
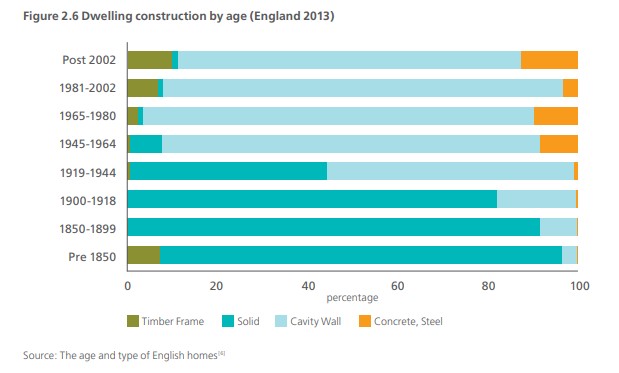
The great majority of dwellings in the UK are built in the ‘traditional’ way using brick, blockwork or stone and constructed on site. Prior to 1919 the walls would most likely have been solid. Cavity walls gradually became the dominant form of wall construction in the inter-war period with the transition taking place at different rates in different parts of the country. In recent years, there has been a growing number of homes built with timber frames supporting the roof structure, but finished to resemble traditional cavity walls, while larger blocks of flats tend to be built with concrete and steel frames.
2.4 Dwelling heating, insulation and energy efficiency in the UK
Around eight in ten homes in the UK use a gas fired central heating system as the primary method for heating. Among those not using this heating method, electric storage heaters or central heating using oil were the most frequent types, Table 2.3. Northern Ireland has a distinctly different fuel mix from the rest of the UK due to an increased reliance on oil for domestic heat. (Figure 2.7).
 BRE The UK housing stock - Extract from BRE Trust Report, the Housing Stock of the UK.
 Dwelling insulation
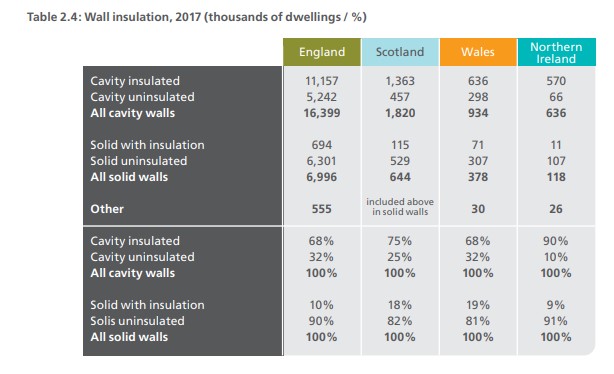
Fabric insulation is important in reducing greenhouse gas emissions from the housing stock as it acts to reduce demand for heat as well as delivering an improved level of thermal comfort and contributing to affordability of warmth. Insulation levels in the UK have risen steadily over time, driven by building regulations for new build housing and the retrofit of the existing stock. Cavity wall insulation is a common energy efficiency measure. The table below shows that Northern Ireland has the highest levels of insulated cavity walls in the stock at 90% of cavity wall dwellings filled, with England and Wales having the lowest penetration at 68%. Grant programmes and other schemes have had considerable success in driving the take-up of measures such as cavity wall insulation and while potential remains, future savings will have to be sought in other parts of the stock, such as the solid wall stock.
Energy efficiency
The Standard Assessment Procedure (SAP) is the UK Government’s recommended system for measuring the energy efficiency of housing. SAP is expressed on a logarithmic scale from 1 (very inefficient) to 100 (zero energy cost). The SAP ratings provide a measure of the annual unit energy cost of space and water heating for the dwelling under a set heating regime, which assumes specific heating patterns and room temperatures. The SAP rating takes into account a range of factors that contribute to energy efficiency, which include:
- – Thermal insulation of the building fabric;
- – Shape of the dwelling and exposed surfaces;
- – The materials of construction;
- – Efficiency and control of the heating system;
- – Fuel used for space and water heating, ventilation and lighting;
- – Ventilation and solar gain characteristics of the dwelling;
- – Renewable energy technologies
SAP is not affected by the individual characteristics of the household occupying the dwelling, nor by its geographical location. The SAP methodology is continually updated to reflect new technologies and knowledge. The version used in this report, for comparison purposes, is SAP 20124.
From Figure 2.8, it can be estimated that the average UK SAP for 2017 is approximately 62, which represents a rise of some 17 SAP points since 1996. Wales has the least energy efficient housing stock, despite great improvements in recent years, reflecting its high proportion of older, solid-walled buildings.
This is the end of the extracts from the BRE Trust Report, the Housing Stock of the UK. This is a significant and very interesting report and I thoroughly recommend that you spend the time to read it in its entirety. The extracts are quite extensive, but only represent a small proportion of the whole report.
Combining two Tables/Figures from the report we can calculate that nearly 7 million homes, about 30% of the England Housing Stock are Solid Wall properties which may be considered Hard To Heat
| Table 2.2: The UK housing stock | Figure 2.6 Dwelling construction by age (England 2013) | |||
| England | Solid walls | Approx Solid walls | Hard to heat | |
| Dwelling age | 6,982,230 | |||
| Pre 1919 | 4,972,000 | 95% | 4,723,400 | |
| 1919-1944 | 3,793,000 | 45% | 1,706,850 | |
| 1945-1964 | 4,582,000 | 10% | 458,200 | |
| 1965-1980 | 4,689,000 | 2% | 93,780 | |
| 1981-1990 | 1,895,000 | 0% | 0 | |
| Post 1990 | 4,019,000 | 0% | 0 | |
| Dwelling type | ||||
| Terrace | 6,669,000 | |||
| Semi-detached | 6,100,000 | |||
| Detached | 4,093,000 | |||
| Bungalow | 2,195,000 | |||
| Flat | 4,864,000 | |||
| Dwelling tenure | ||||
| Owner occupied | 15,089,000 | |||
| Private rented | 4,789,000 | |||
| Social rented | 4,072,000 | |||
| Location | ||||
| Urban | 19,796,000 | |||
| Rural | 4,154,000 | |||
| Total dwelling stock | 23,950,000 | |||
| Average dwelling size | 94 m2 | |||
| Dwelling age | 29.15% | |||
| Pre 1919 | 20.80% | 95% | 19.7600% | |
| 1919-1944 | 15.80% | 45% | 7.1100% | |
| 1945-1964 | 19.10% | 10% | 1.9100% | |
| 1965-1980 | 19.60% | 2% | 0.3920% | |
| 1981-1990 | 7.90% | 0% | 0.0000% | |
| Post 1990 | 16.80% | 0% | 0.0000% | |
| Dwelling type | ||||
| Terrace | 28.00% | |||
| Semi-detached | 25.50% | |||
| Detached | 17.10% | |||
| Bungalow | 9.20% | |||
| Flat | 20.30% | |||
| Dwelling tenure | ||||
| Owner occupied | 63.00% | |||
| Private rented | 20.00% | |||
| Social rented | 17.00% | |||
| Location | ||||
| Urban | 82.70% | |||
| Rural | 17.30% |
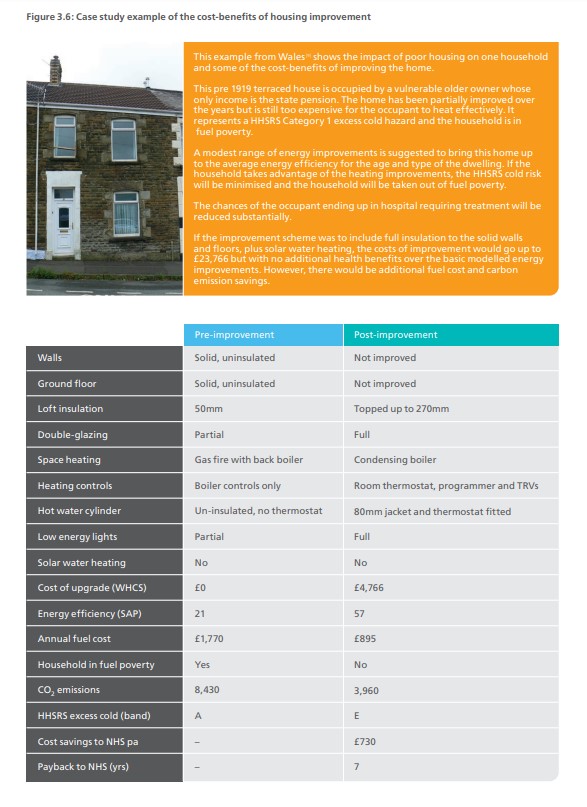
Using the above data and the case study;
| Hard to heat | Cost of upgrade | Annual Fuel Cost | CO2 emissions | Cost savings to NHS pa | Annual Benefit £ | Pay back period years |
| 1770 | 8430 | |||||
| 895 | 3960 | |||||
| 4766 | 875 | 4470 | 730 | |||
| 6,982,230 | 33,277,308,180 | 6,109,451,250 | 31,210,568,100 | 5,097,027,900 | 11,206,479,150 | 2.97 |
The sums of money required are huge but the payback period is very impressive at only 3 years. This is from a economic perspective though as different bodies benefit form the savings. If you only consider the Annual Fuel Cost savings the pay back period of the whole of the Cost of upgrade is just under 5.5 years, whereas the Cost savings to the NHS is 6.5 years.
It would seem to me that given these figures it would be a good investment for the Government to pay for the cost of the upgrade to the housing stoke just to get the Savings to the NHS. Especially, with the scale of purchasing that would involve, within the timescales of COP in Glasgow [The 26th UN Climate Change Conference, November 2021, at the Scottish Event Campus (SEC) in Glasgow], that the Cost of upgrade could be kept to a price of £4,766.
From an individual perspective, I think the actual cost of the upgrades listed would be at least four times as much.
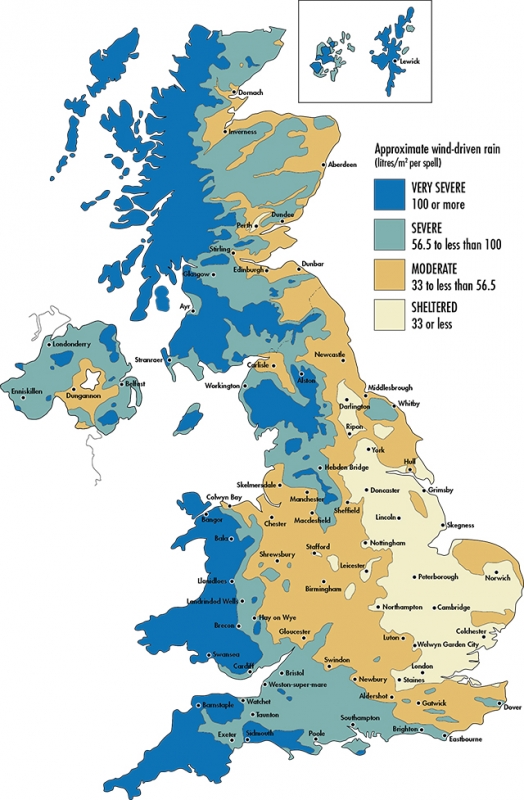 In addition to the 'hard to heat' challenge of solid walls, according to the same report, 5,242,000 homes in England have cavity walls as yet uninsulated, 32%. However, there appears to be no information about the proportion of properties which should not have full cavity wall insulation due to the location exposure to wind driven rain.
Before we discuss the impact of rain to insulation, we sound consider the veracity of the report by virtue of the body who produced the above report, the BRE Trust.
From Companies House;
BRE Trust (the "Trust") is a company limited by guarantee (Company number 03282856) and is registered as a charity in England and Wales (No 1092193) and in Scotland (No SCO39320). The Trust was established to provide independent, non-sectorial ownership of the Building Research Establishment, an Executive Agency of the Department of the Environment, when it was transferred to the private sector in March 1997. The Trust is governed by its most recent Articles of Association which were approved by a meeting of members on 6th March 2019. In addition, the Trust provides independent ownership of BRE Group Limited ('BRE Group') which in turn is the owner of businesses resulting from the privatisation of the Building Research Establishment. The Trust protects the independence of BRE Group to ensure that its advice and research remain objective and free from bias. BRE Group continues to have a strong reputation, both nationally and in the international arena, as an impartial and respected consultancy, science and research organisation. BRE Group Limited is the holding company for Building Research Establishment Limited, BRE Global Limited which are established in England and Wales and BRE Global Assurance (Ireland) Limited, a company established and resident in the Republic of Ireland. These subsidiaries in tum are owners of other trading companies in the UK and the People's Republic of China.
I have been fortunate enough to have visited the Building Research Establishment in a work capacity and have faith in their work and this report.
The adjacent map was found on the LABC website.
The possibility of wind-driven rain penetrating a cavity wall depends on the exposure level of the site or building. This varies according to where it is in the country, topography and various site factors.
Following problems with rainwater penetration in parts of the UK in the 1980’s, Approved Document C of the Building Regulations was introduced in 1985 and highlighted where consideration must be given.
The principal change was that the use of full-fill cavity wall insulation was not permitted in areas of very severe exposure to wind-driven rain where fairfaced masonry is used for the outer leaf. However, the rules also reflected the reduced risk where impermeable and rendered outer leaf constructions were used and therefore permitted the use of full fill insulation.
At the time of introduction, the standard cavity width between the inner and outer leaf of masonry was significantly narrower than it is today (often just 50mm). Energy efficiency standards have progressively improved since then and cavity widths have increased to accommodate greater thicknesses of insulation. It is now more common to see cavities wider than 100mm in both new homes and extensions.
It is widely recognised that as cavity widths increase the likelihood of rain penetration reduces.
The rules in Approved Document C have changed to reflect the alterations and in the current 2010 edition it is permissible to build with full-fill insulation behind tooled flush jointed fair faced masonry providing the cavity is a minimum of 150mm wide. However, this is not the case with Warranty provider technical standards where the restriction on full-fill remains.
Old Housing Stock, decarbonisation towards net Zero
It is therefore evident that having an old housing stock creates problems whilst attempting to reduce carbon footprint, both in terms of nationally and individually.
In our quest for a carbon-friendly future, decarbonising some industries is proving far more challenging than others. One of the UK's biggest challenges is home heating, which is yet to be electrified (so unable to reap the benefits of cleaner, greener electricity), and accounts for 14% of our total carbon emissions.
17 million UK homes still use gas boilers, burning tonnes of fossil fuels to stay warm. With over 1.5 million people replacing their boilers every year, there are huge gains to be made, but we need affordable alternatives - hardware that helps us bring the benefits of cleaner, greener renewable energy to these hard-to-reach sectors.
A Guide to Decarbonisation of Heat
Decarbonising heat is key to achieving Net Zero, and innovators have a vital role to play. Here is our overview of the decarbonisation challenge and how we can tackle it through low carbon home heating innovation.
Why do we need to decarbonise heat?
Heating is the United Kingdom’s biggest source of carbon emissions, which are the fossil fuel gases that contribute to climate change.
In June 2019, the UK Government committed to a Net Zero carbon emissions target across the economy by 2050.
How much does heating contribute to UK carbon emissions?
Heating accounts for about 37% of total UK carbon emissions when including industrial processes. The breakdown of UK carbon dioxide emissions from heating is:
Space heating (including a relatively small amount of cooling) = 17%
Hot water = 4%
Cooking = 2%
Industrial processes = 14%.
Of the 17% of carbon emissions from heating (and cooling) in buildings, about 13-14% can be attributed to domestic homes.
Hot water use is significant in the health, hospitality, emergency services and education sectors, driven by demand for washing facilities. Heat demand for cooking and catering is high in the hospitality sector.
Heat is used in a range of industrial processes, from high temperature blast furnaces for making iron through to lower temperature steam in food thawing processes.
Top 5 reasons why decarbonising heat is so hard:
Net Zero targets – under plans to reduce carbon emissions to Net Zero by 2050, certain sectors of the economy will continue to emit carbon that will need to be offset. But that means tougher targets for heating, with most buildings needing to become zero carbon.
Size of the challenge – only about 5% of homes currently have low carbon heating. The UK is dominated by fossil fuel gas – with 85% or about 24.5 million homes heated by natural gas.
No silver bullet solution – low carbon or carbon neutral heating solutions already exist, however a top-down “blanket” solution such as all-electric or all-hydrogen is projected to cost twice (2.28%) or three-and-a-half times (3.51%) as much respectively compared to a bottom-up approach that chooses the best low carbon heating solutions on a place by place basis.
Poor energy efficiency – UK building stock is generally of poor thermal efficiency. Around 2/3 of households suffer from either damp, drafts, or overheating – wasting energy and making home life uncomfortable.
Incentives and workforce – almost half of people (48%) have no awareness of low carbon heating and current incentives do not encourage many households to switch to low carbon heating. For every 100 qualified gas engineers in the UK there are less than two low carbon heating engineers, while 74% of heating professionals were not fully confident in selecting suitable low carbon heating for clients.
What do Net Zero targets mean for heating?
Under the UK’s new 2050 Net Zero carbon emission targets, the Committee on Climate Change expects certain parts of the economy – such as air travel, agriculture and cement-making – will continue to emit some carbon. These emissions will need to be captured using Bioenergy and Carbon Capture and Storage technology or be offset through measures such as carbon sequestration by planting trees.
But for heating, the overwhelming majority of buildings and homes in the UK will need low carbon solutions that enable them to reach near zero carbon by 2050. Though there will be exceptions and some hard-to-treat buildings could continue to be responsible for significant emissions.
What is the size of the decarbonisation challenge?
Currently, heating in the UK is dominated by fossil fuels, with 85% or about 24.5 million homes (and over two million businesses) supplied directly by the mains gas grid. Converting them to low carbon heating over the next 30 years to 2050 is a similar sized task as the switch to central heating – which took 35 years to increase from 30% to 95% of homes from 1970s,
In comparison, 8.6% of homes are heated by electricity generated by traditional storage heaters or modern heat pumps, 4.1% by heating oil, 0.8% by solid fuel, and 0.7% by LPG. In total, around 3.7 million homes in Britain use non-mains gas fuels for their primary heating, with only the Netherlands having a higher penetration of natural gas for heating across Europe.
Yet 90% of people say they prefer their fossil fuel gas boiler to low carbon alternatives and almost half of people (48%) are not aware that gas boilers are a source of carbon emissions.
Extracts from the BEIS report Clean Growth - Transforming Heating.
1.1 Heating is central to our lives. In our homes, we rely on it for comfort, cooking and washing. Businesses need heating and cooling for productive workplaces and heat is integral to many industrial processes. It is the biggest reason we consume energy in our society.
1.2 Heat accounts for over a third of the UK’s greenhouse gas emissions. Under the Climate Change Act 2008, the Government has committed to reducing annual greenhouse gas emissions by at least 80% by 2050 and has recently sought advice from the Committee on Climate Change as to when the UK should achieve net zero emissions across the economy. Meeting our existing Climate Change Act commitments will require decarbonising nearly all heat in buildings and most industrial processes. If we fall short of this, deeper emissions reductions will need to be made in sectors that may prove less cost-effective to decarbonise, such as agriculture.
1.3 Over recent years, lower carbon technologies have provided an increasing proportion of our nation’s heating. Electric heat pumps and biomass boilers are used in many homes and businesses and increasing volumes of biomethane are blended with natural gas in the gas grid. Meanwhile a substantial number of customers, particularly in premises off the gas grid, continue to use direct electric heating systems which have become cleaner as the power sector continues to decarbonise.
1.4 However, heating remains the largest source of our greenhouse gas emissions. Most of the heating in our buildings and industries is delivered by fossil fuels; natural gas remains the predominant source of heating for the vast majority of customers connected to the grid. The prevalence of the gas grid presents a particular challenge to the UK in enabling the necessary shift to low carbon heat. Whichever approaches are taken, the way heating is supplied to nearly 24 million homes, businesses and industrial users connected to the gas grid will need to change. Ensuring this transition is as smooth as possible represents a major national challenge over the coming years.
The Government’s approach to heat
decarbonisation
1.5 The Government has emphasised the central importance of decarbonising heat to achieve our Industrial Strategy and clean growth objectives, as we transition to a low carbon economy. The Government’s approach to heat decarbonisation encompasses a range of programmes and initiatives, underpinned by innovation and “learning by doing”, which aims to achieve:
- a reduction in heat demand, by seeking to:
- – build a market for energy efficiency, particularly among owner occupiers;
- – improve the way businesses use energy, to support delivery of our ambition to reduce business energy use by 20% by 2030;
- – improve the energy efficiency of new and existing buildings via updates to building standards and through the Industrial Strategy Buildings Mission, to halve the energy used in new buildings by 2030; and,
- – work with industry to reduce energy demand through the £18m Industrial Heat Recovery Support Programme and the £315m Industrial Energy Transformation Fund.
- substantial growth in no or low-regrets low carbon heating in the shorter term by supporting the deployment of:
- – heat networks: the Heat Networks Investment Project (HNIP) is a Government Major Project which will invest £320m of capital funding in heat network projects through grants and loans. This is provided as ‘gap funding’ to leverage around £1bn of private and other investment, and pave the way for the continued growth of the UK heat networks market; and,
- – lower carbon heating solutions: through the Renewable Heat Incentive we are spending £4.5bn between 2016 and 2021 to support innovative low carbon heat technologies in homes and businesses, such as heat pumps, biomass boilers and solar water heaters. We have also reformed the Renewable Heat Incentive to focus the scheme towards long term decarbonisation through greater uptake of technologies such as heat pumps and biomethane. Beyond the Renewable Heat Incentive, our ambition is to phase out the installation of high carbon fossil fuel heating in buildings off the gas grid during the 2020s, starting with new buildings.
- a new long-term policy framework for heat: to bring about and support the national transition required to meet our long-term emissions reduction commitments. This framework must:
- – ensure that appropriate support is in place for consumers;
- – enable the most cost-effective transition across energy industries and infrastructure; and,
- – contend with the uncertainties arising from the multi-decade heat decarbonisation timetable. Advances in technologies may open up new solutions, and economywide developments such as the decarbonisation of transport and power generation may alter the feasibility of others.
This is just a short extract from the beginning of an extensive 136 page report, again worth reading; - BEIS report Clean Growth - Transforming Heating.
I think that the above gives a taste of the scale of the problem posed by having such a large proportion of old housing stock, on a national level. This transfers down to an individual level in terms of the base condition of the home, and the requirements necessary the reduce the carbon footprint.
The above article is mainly extracts from other peoples work and reports, with only a little of my own content. On the one hand I apologise for not writing more but on the other, I do think it is beneficial to use official and available information where it illustrates the problem, and should carry more gravitas than my writings. I acknowledge and thank the people and bodies involved in creating the works from which I have extracted the material, and suggest that you follow the links in the body of the text to read the whole of their reports.
Whether one lives in any of the following old homes, or anywhere in between, we all have to live and die on this one single planet, and eventually, hopefully, in harmony with it.
 Kotelnicheskaya apartment block, one of Stalin's "Seven Sisters", a group of seven skyscrapers built in the 1950s, as seen from the Kremlin
 Stowe House
 The old village adjacent to Takoukout Well, possibly before the current village of Tatokou was built. On the bank of a dry river bed.
Go back to the top of this tab in this section
Go to the next tab in this section
Our 1930's home
Our 1930s Home
I don't actually know the date our house was built.
However, it was probably around the 1930s mark according to this website about 'when was my house built' and the BRE Trust Report, the Housing Stock of the UK.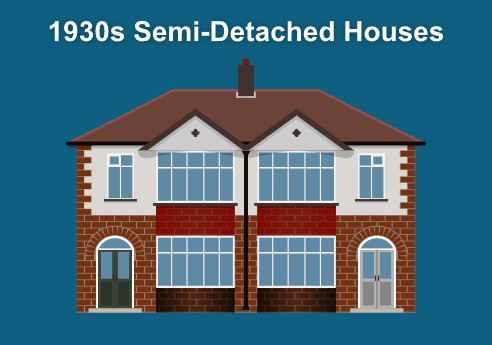
The image is not dissimilar to our house.
A nearby house in its near original or at least un-improved is in the adjacent photo. 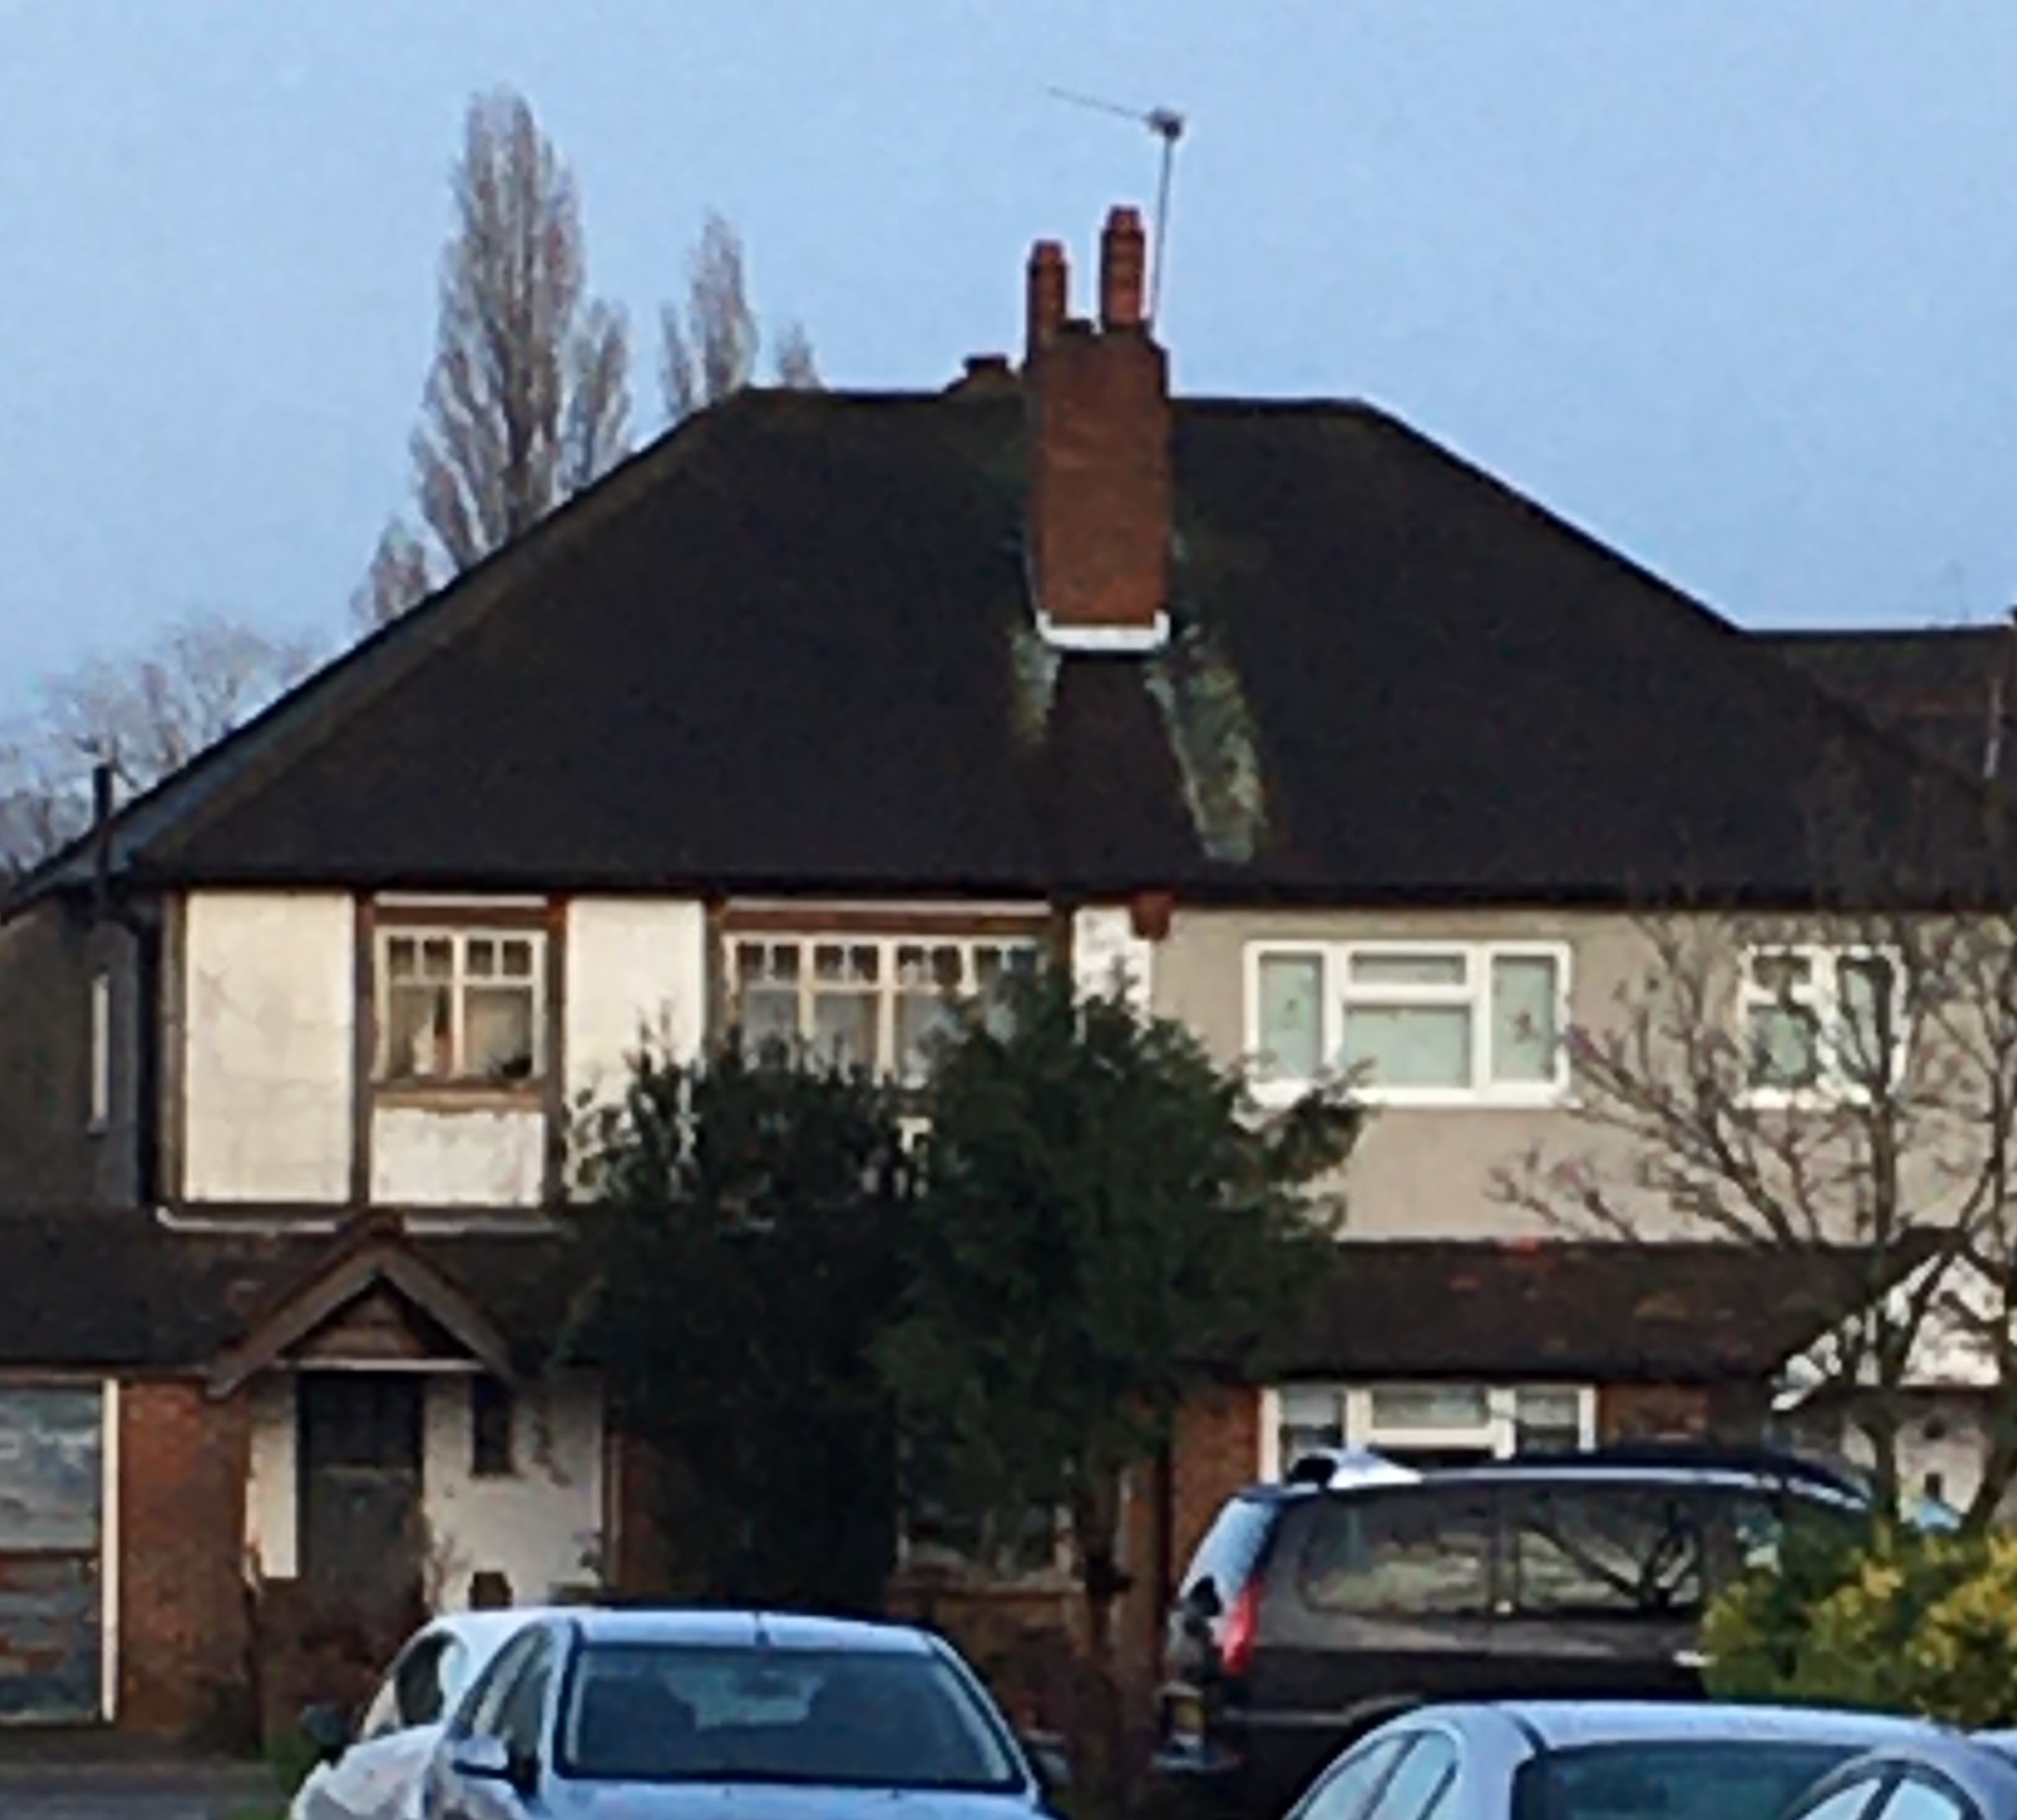
The semi on the left hand side appears to have steel Crittall windows or similar. It also has some decorative timber work. The right hand semi has replacement uPVC double glazing.
The house style seems to match the guide.
Family houses that embraced elements from previous eras often found in town and city commuter belts.
These properties are commonly found across the country today.
Some observable characteristics include:
- 2 storeys high, although many have been extended vertically;
- Recessed porches
- Wide bay windows on both storeys;
- Some parts of the building may be pebble-dashed;
- Hipped roof;
- Often found on relatively quiet streets and have garages and off-street parking / driveways;
- Some have maintained original oak parquet flooring;
- Sometimes built in detached form;
- Due to their commonality, it’s relatively easy to ascertain the value of these kinds of properties.
There is however an anomaly regarding this date. We have solid walls.
Cavity Wall Construction History
Cavity wall construction has almost entirely replaced solid wall construction in the United Kingdom.
It evolved in the latter years of the nineteenth century and became common in dwellings in northern and western Britain in the early 1900s.
Its widespread adoption as virtually standard in the construction industry happened throughout the building booms of the 1920s, ‘30s and ‘40s.
When identifying whether a wall is of solid or cavity construction, something to be aware of is that the presence of headers in the brickwork is not always indicative of solid brickwork.
From the mid-1940s to the mid-1950s, “snapped headers” were often used to emulate English bond in cavity construction.
In the early years the skins of these cavity walls were held together by metal ties made from cast or wrought iron, mild steel or copper.
Most houses built after 1930 have cavity walls. It is very rare for houses build before 1920 to have cavity walls, while most houses built after 1985 will have been constructed with cavity wall insulation built in. Most older houses will have solid walls.
Cavity walls are exactly what they sound like: a wall made up of two ‘skins’ with a gap in between them, known as a cavity. Cavity walls were designed to help prevent problems with damp. The cavity stops penetrating moisture entering the inside of a building, and helps the water drain back out of the wall again. Cavity walls differ significantly from solid walls, particularly in the way they handle moisture and prevent a damp atmosphere.
The Early History of the Cavity Wall
The cavity wall was first introduced in the 19th century, as an alternative to a simple solid wall. Cavity walls became more widespread in the 1920s, and they’ve continued to grow in popularity to this day. The widths of the cavities were originally smaller than they are today, and they were initially without insulation.
Typically, the two skins have always been held together with ties made from metal. These ties used to be made from iron, mild steel, or copper, but such materials were prone to corrosion. Wall tie corrosion was first noticed during the 1960s, and from this point, stainless steel became the material of choice for the manufacture of wall ties. Stainless steel is more resistant to corrosion than the earlier metals, and this helps keep the structural integrity of the building intact for longer.
Whilst our house looks as if it is a 1930s house the above seems to suggest that generally, houses were being built with cavities by 1930.
A proportion of the house is covered with pebbledash and most of rest is render and paint. There is a small area of exposed brickwork which consists of headers and stretchers, which is typical of solid walls.
Coring through an external wall, revels a small jump between two bricks, which for a while made me think it was a very narrow cavity, but inspection of the extracted core confirmed that it was a solid wall.
The EPC register is a public record. EPC standing for energy performance certificate, which contains amongst many other things, information about wall construction, as it has a significant impact of a buildings energy performance.
Checking the register for nearby houses with a certificate revealed that they also had solid walls.
It therefore seems that either the builder of our street were either slow on the uptake of Cavity Walls, or perhaps it was build earlier, and they were early adopters of that fashion of house, which was described as popular in the 1930s.
Maps give some indication but do not resolve the date any further.
Development of Epsom Court
Before delving into the maps of Epsom and particularly Epsom Court I would like to refer you to The Epsom and Ewell History Explorer (EEHE) and the article on Epsom Court.
This site brings together articles covering the local history of the area. The articles may have been inspired by many things including specific suggestions, memories, printed works and of course the internet.
Epsom Court is one such article.
Epsom Court Alias Epsom Lodge or Court Farm, formerly the Saxon manor house of Epsom established upon a Roman site?
The Location It may be conjectured that a Roman road linked the villa and tile-works on Ashtead Common to the site of Epsom Court Farm where Toland, in his letter descriptive of Epsom from 1711, mentioned Roman remains. This would have extended from Woodcock Corner on the parish boundary, proceeding south of the present B280 Chessington Road and Christchurch Road to Clayhill Green. Seller’s map of 1690 indicates a secondary route to Ewell which passed Ashtead’s Woodfield before continuing north of Ebsham Wells and then on by Ebsham Court generally following a line suggested by Reginald White on his map in Ancient Epsom (1928). This way would have crossed a stream which still issues from The Cricketers’ pond at Stamford Green but has been contained in a culvert below Christchurch Road. At some time in history, however, a ford here would have been lined with imported stones (likely to have been flints) to improve the going over clay and so the location became known as Stamford as a corruption of the Old English stan [stone] ford. Then, as a letter in The Times of 31 August 1925 reported, ‘at the back of West Hill House, Epsom, there was a piece of Roman road showing … [which] might only have gone to Ebba’s Hame, the Court Farm, Epsom’. From Clay Hill Green the route continued along the present bridle path, Pound Lane. The supposed Roman road appears on the 18th century Rocque map included later in this piece.
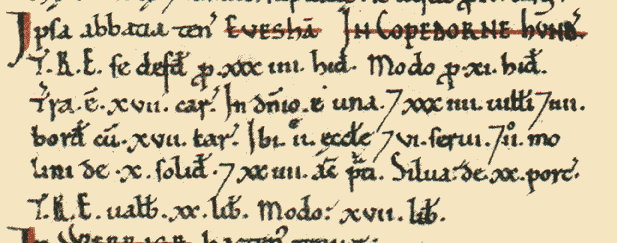
Domesday Book
The article enticed me look at the entry for Epsom in the Domesday Book, a complete survey of England written in AD 1086.
Epsom was a settlement in Domesday Book, in the hundred of Copthorne and the county of Surrey.
It had a recorded population of 44 households in 1086, putting it in the largest 20% of settlements recorded in Domesday.
Land of Chertsey (St Peter), abbey of
Households
Households: 34 villagers. 4 smallholders. 6 slaves.
Land and resources
Ploughland: 17 ploughlands. 1 lord's plough teams. 17 men's plough teams.
Other resources: Meadow 24 acres. Woodland 20 swine render. 2 mills, value 10 shillings. 2 churches.
Valuation
Annual value to lord: 17 pounds in 1086; 20 pounds in 1066.
Owners
Tenant-in-chief in 1086: Chertsey (St Peter), abbey of.
Lord in 1086: Chertsey (St Peter), abbey of.
Lord in 1066: Chertsey (St Peter), abbey of.
Other information
Phillimore reference: Surrey 8,9
The Land was owned by the Abbey of Chertsey (St Peter) in both 1066 and in 1086.
There were 6 slaves in the community of 38 villagers and smallholders.
The value to the lord was £17 in 1086. Compare this to the Tithe Values below.
There were 14 places in the hundred of Copthorne in Domesday Book, of which Epsom was one.
Memory-Map Historical Maps
These maps are predominantly old Ordnance Survey maps which OS sold the rights to Cassini Maps. The historical maps are no longer available to purchase via Memory-Map.
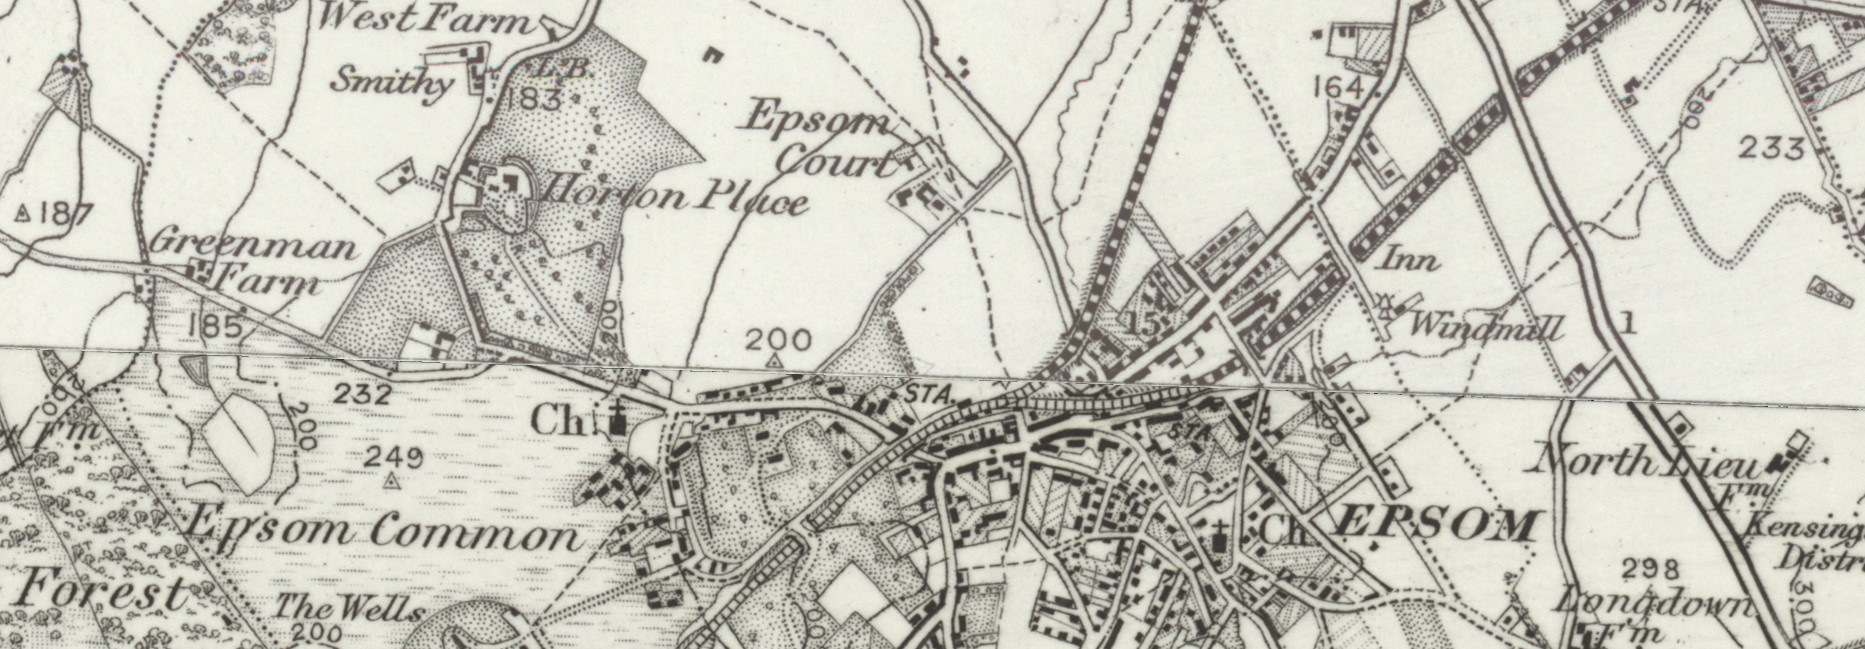
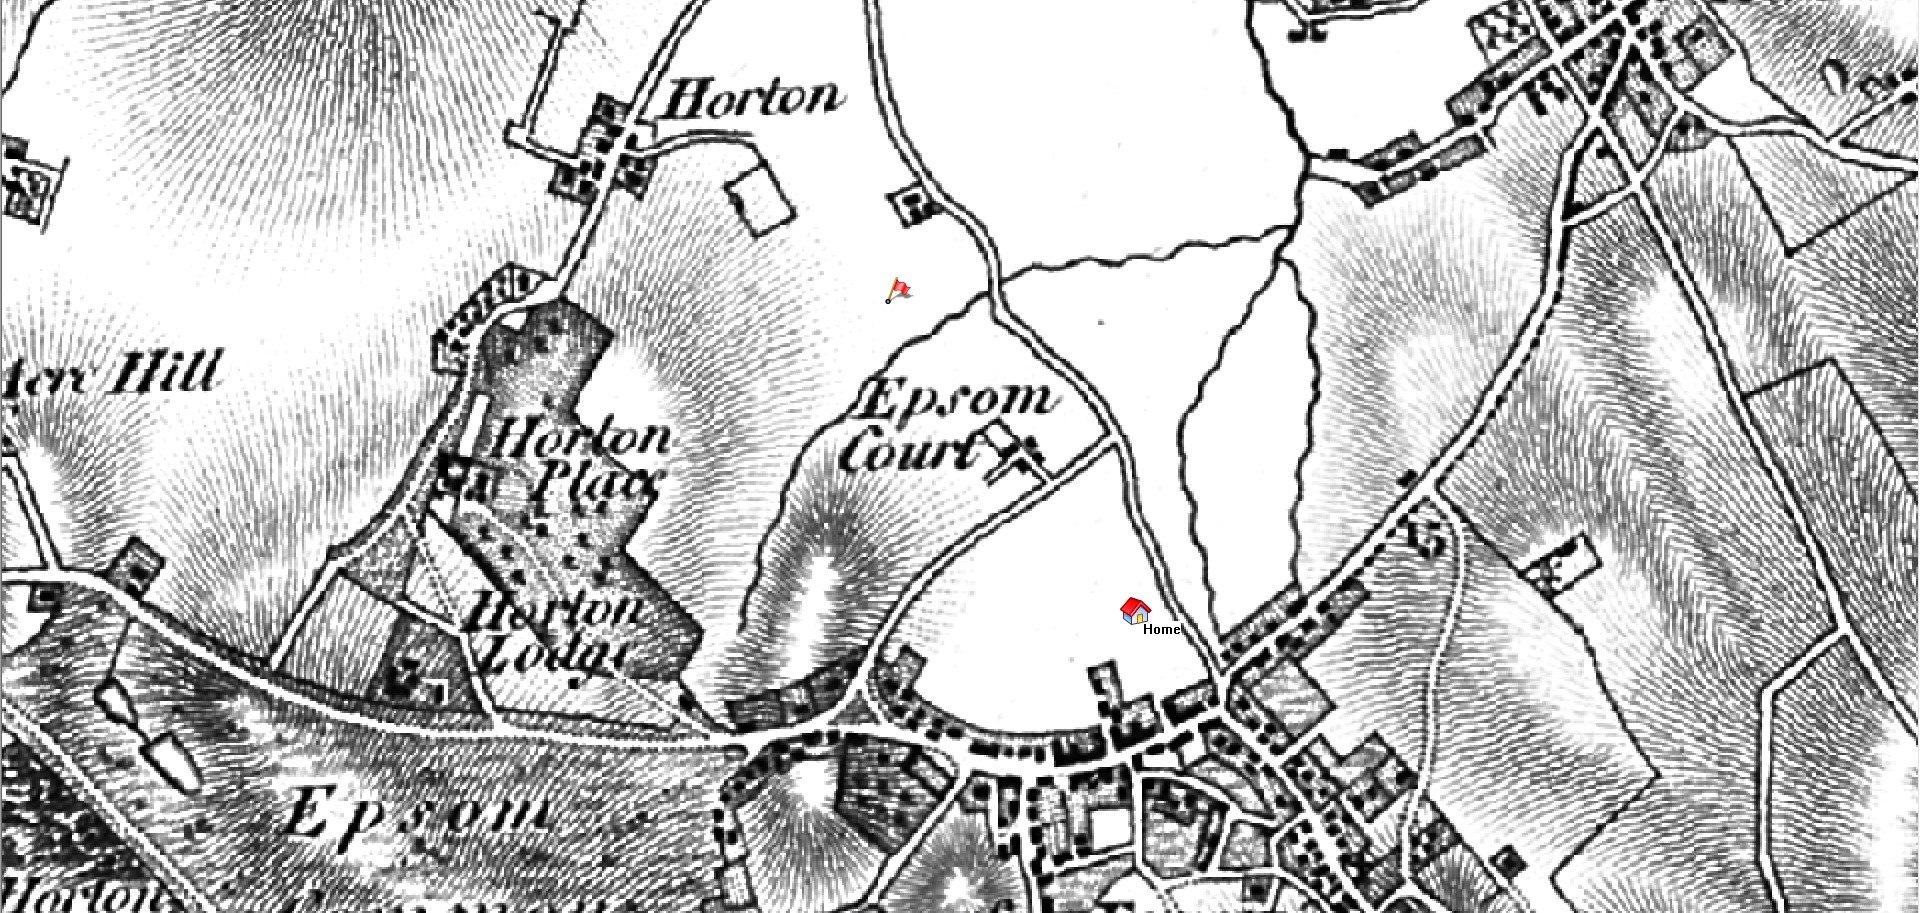 Map 1800s Epsom Court - Extract from Memory Map Historical Maps
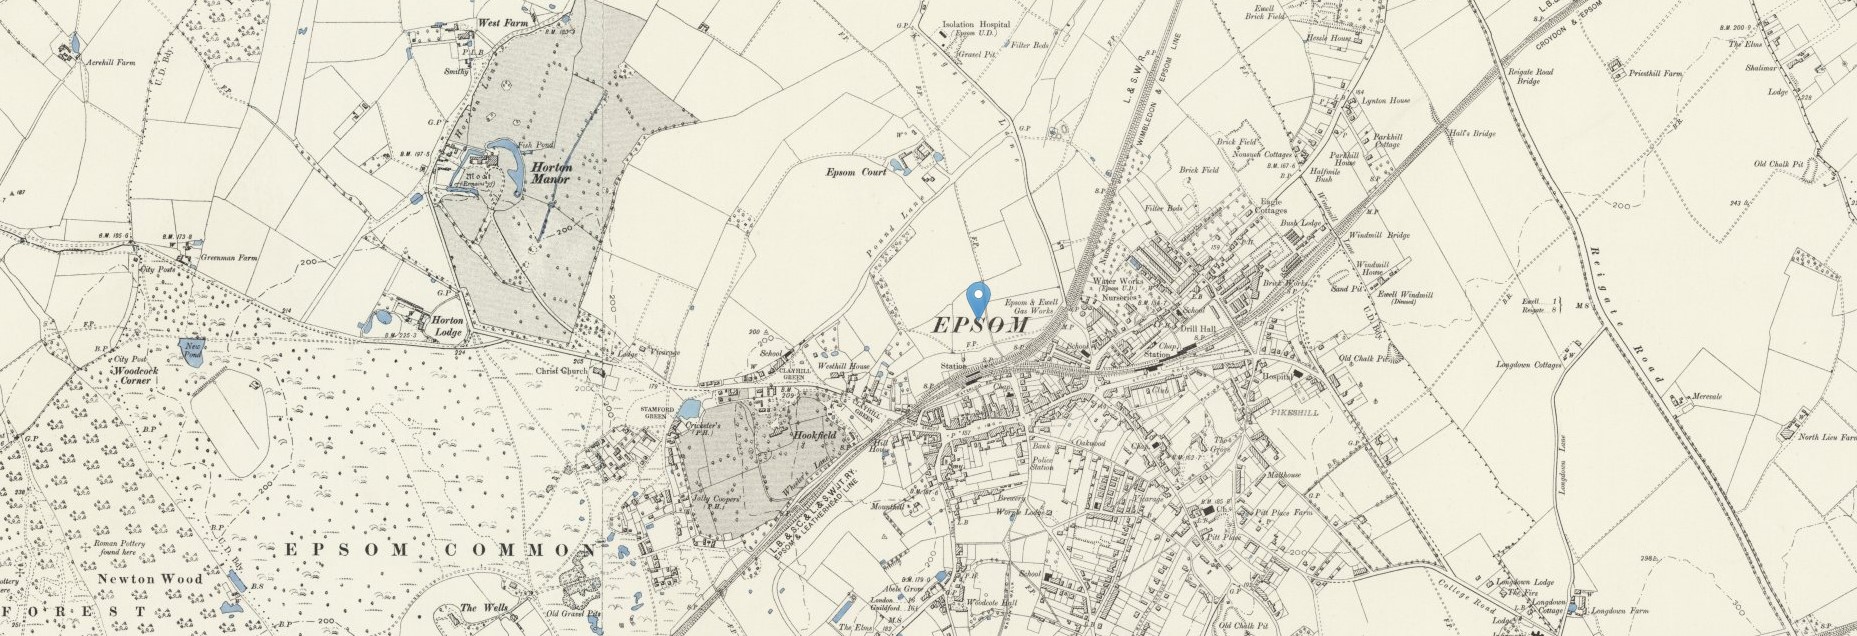
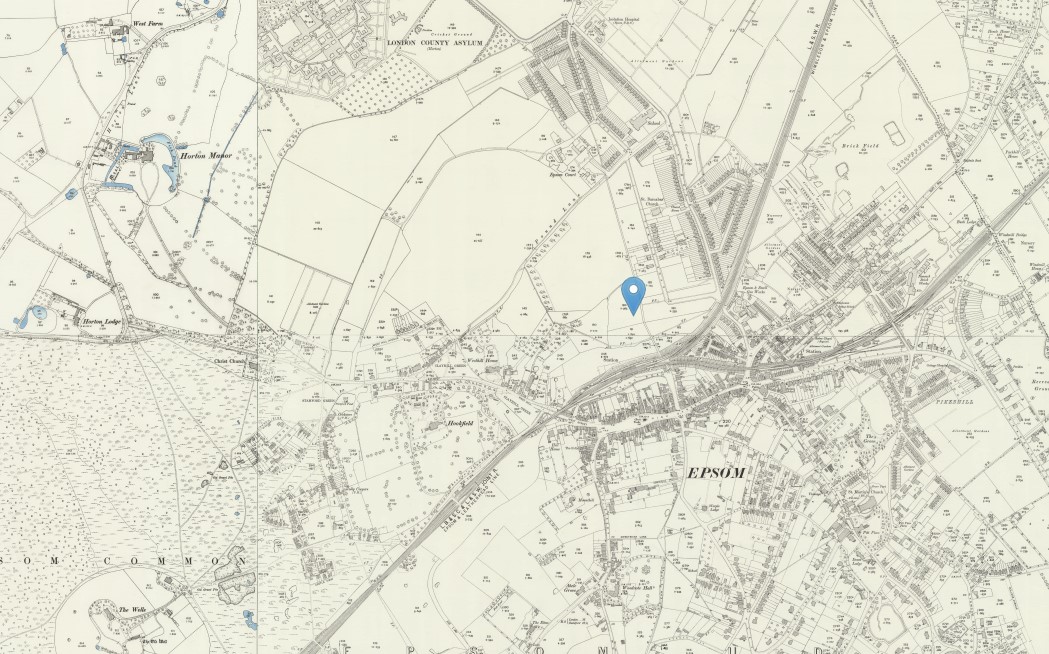
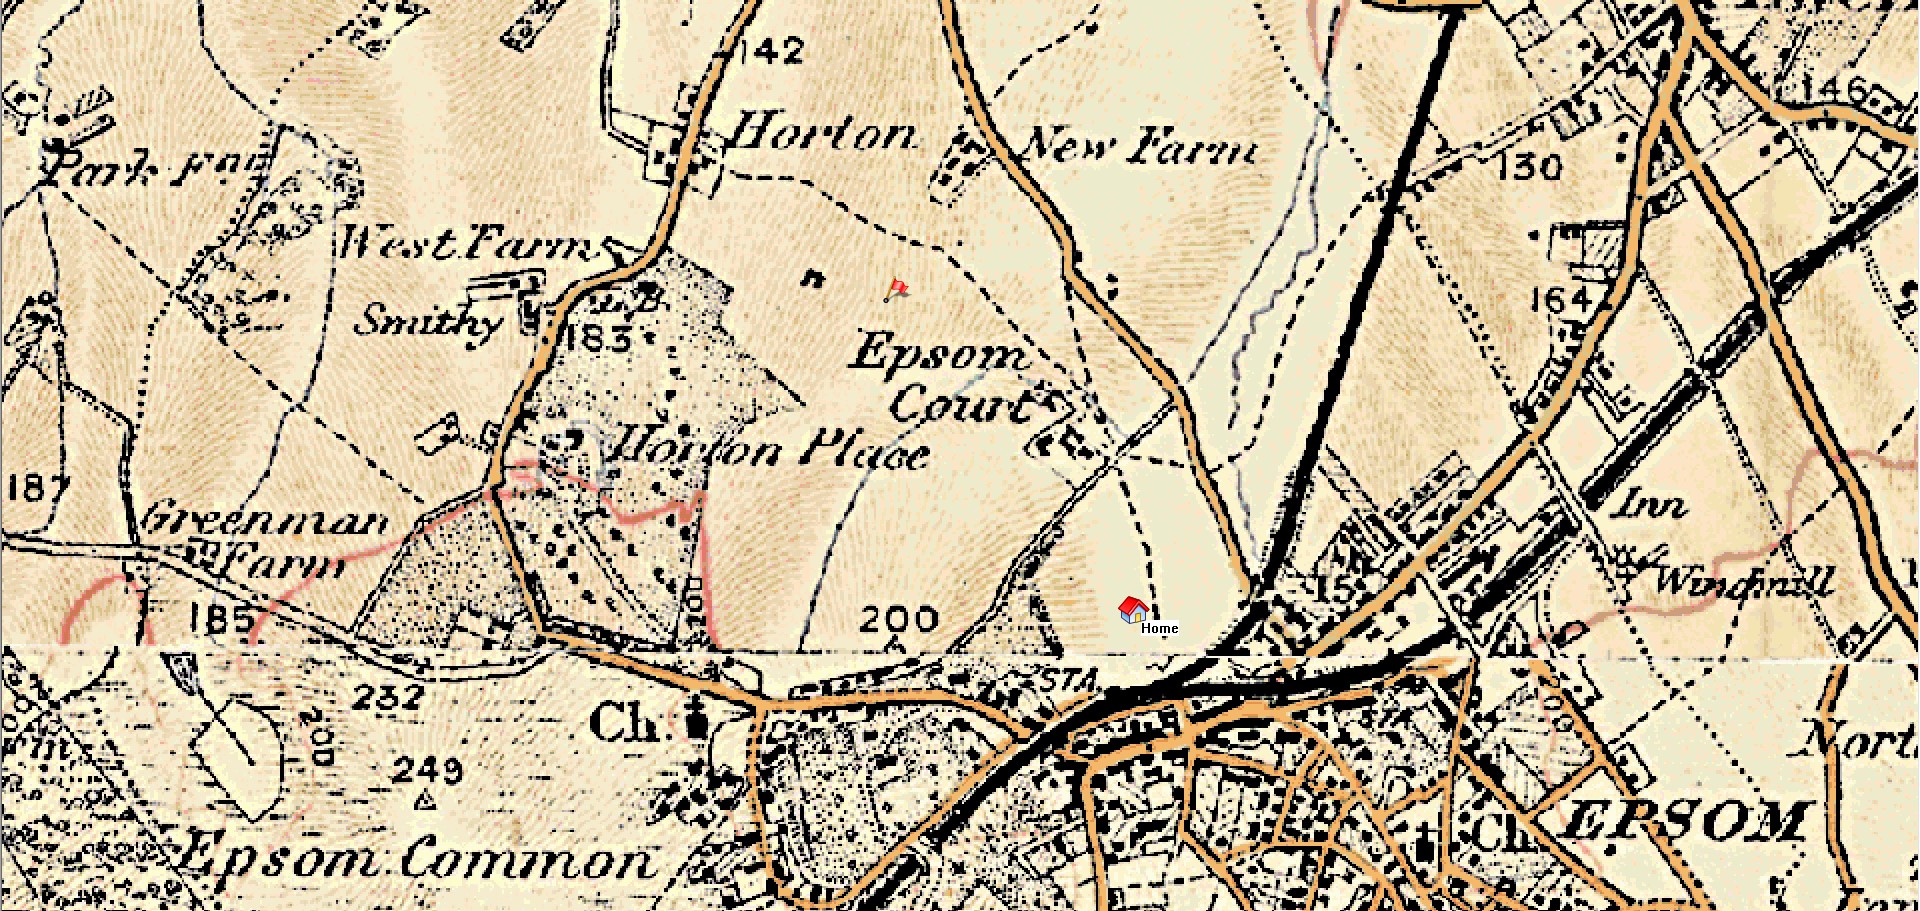 Map 1900s Epsom Court - Extract from Memory Map Historical Maps
A century on and the railways have arrived, but the area is still predominantly fields or common land. The railway built to the north of Epsom, on the outskirts. Epsom Court clearly visible.
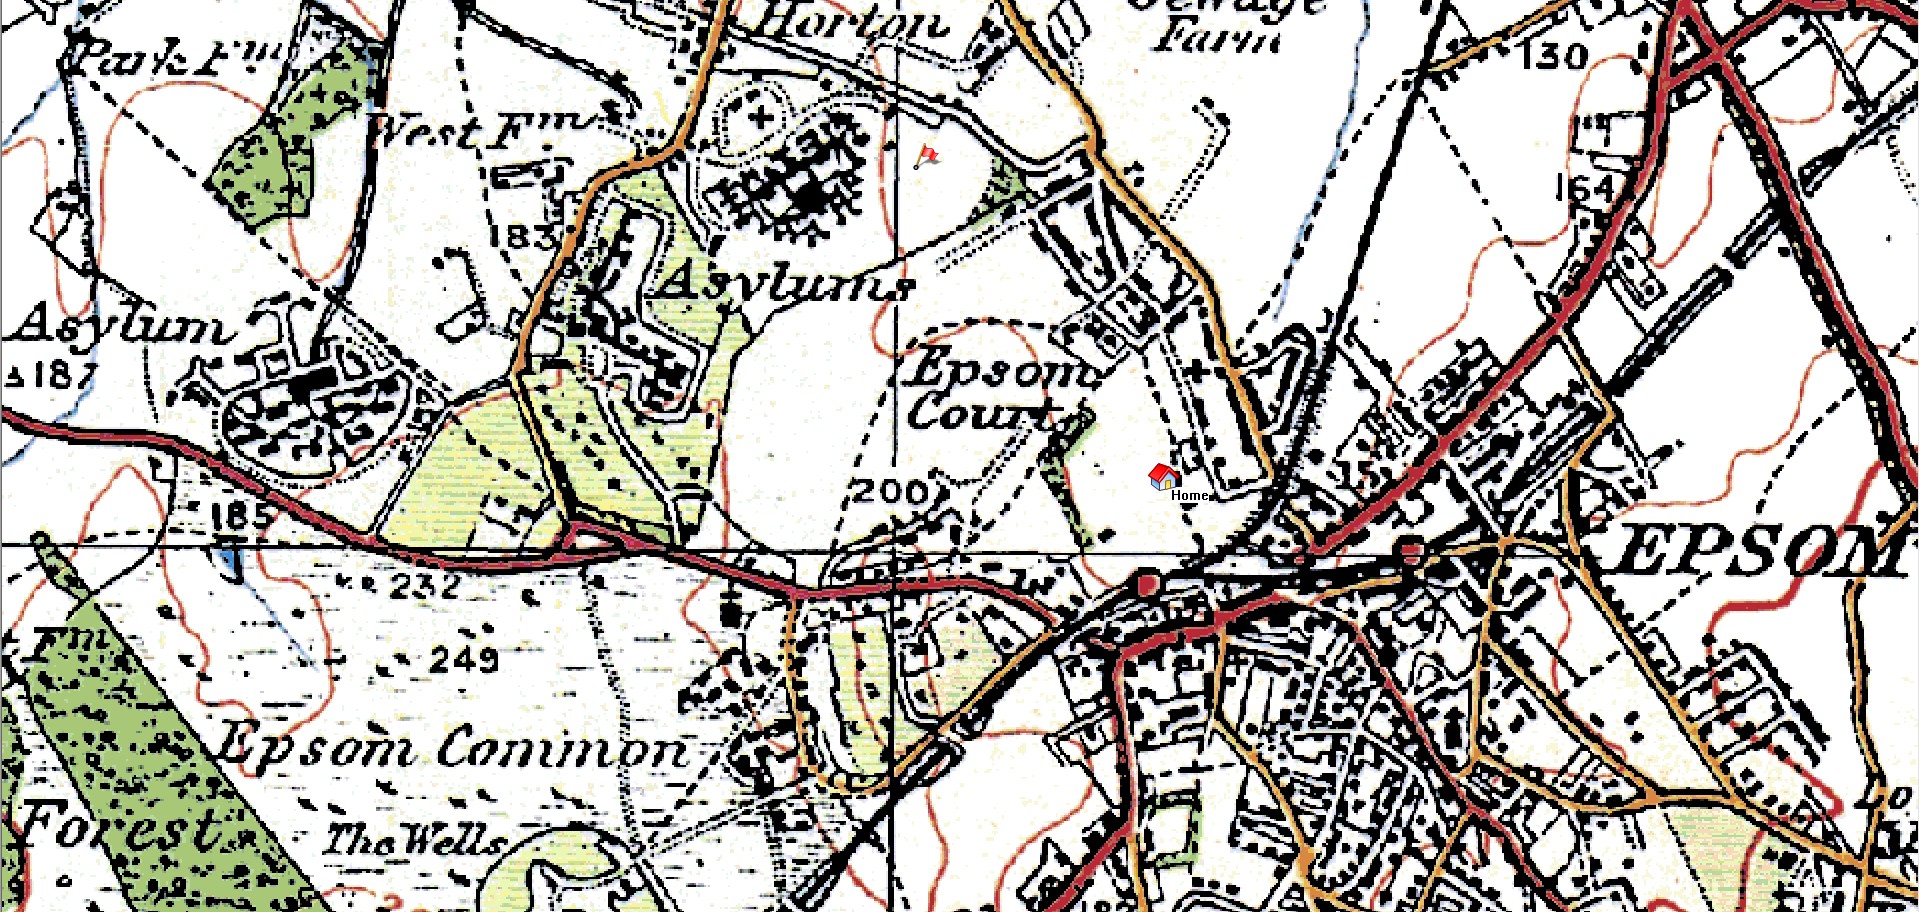 Map 1920s Epsom Court - Extract from Memory Map Historical Maps
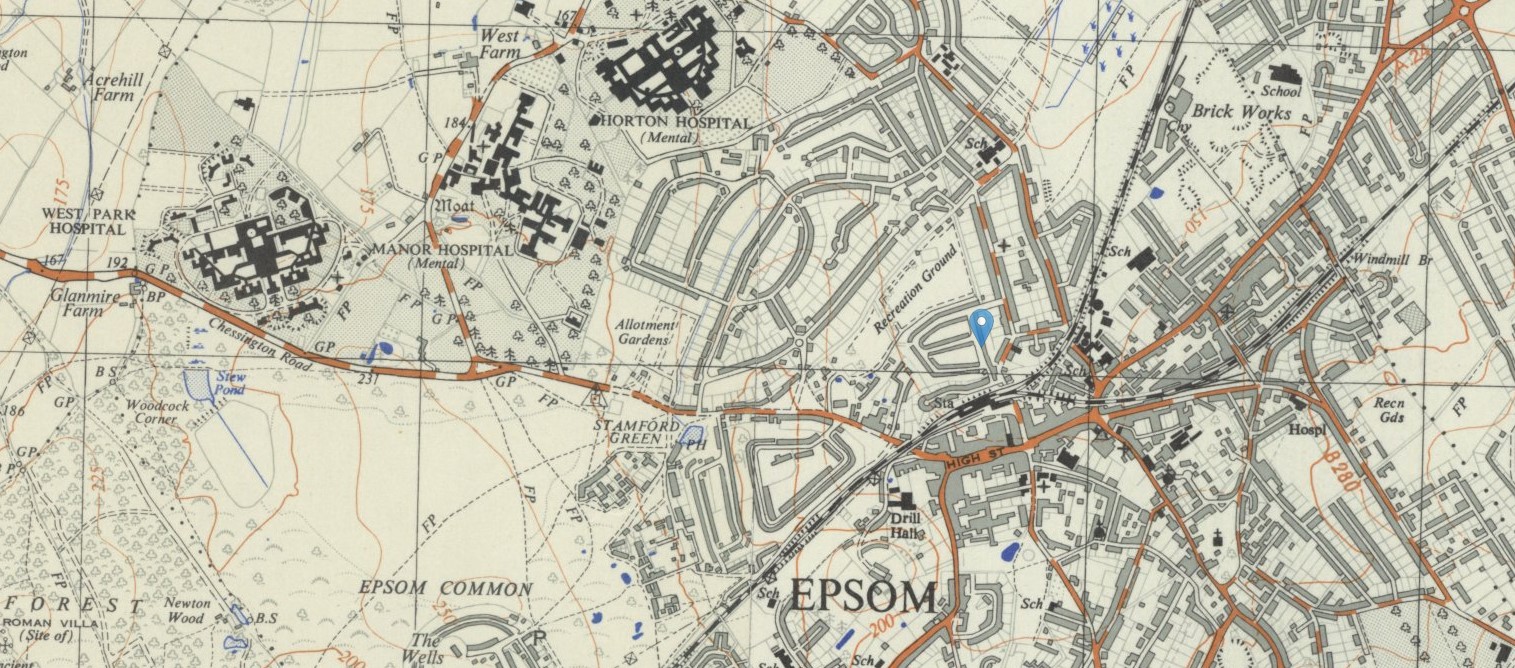
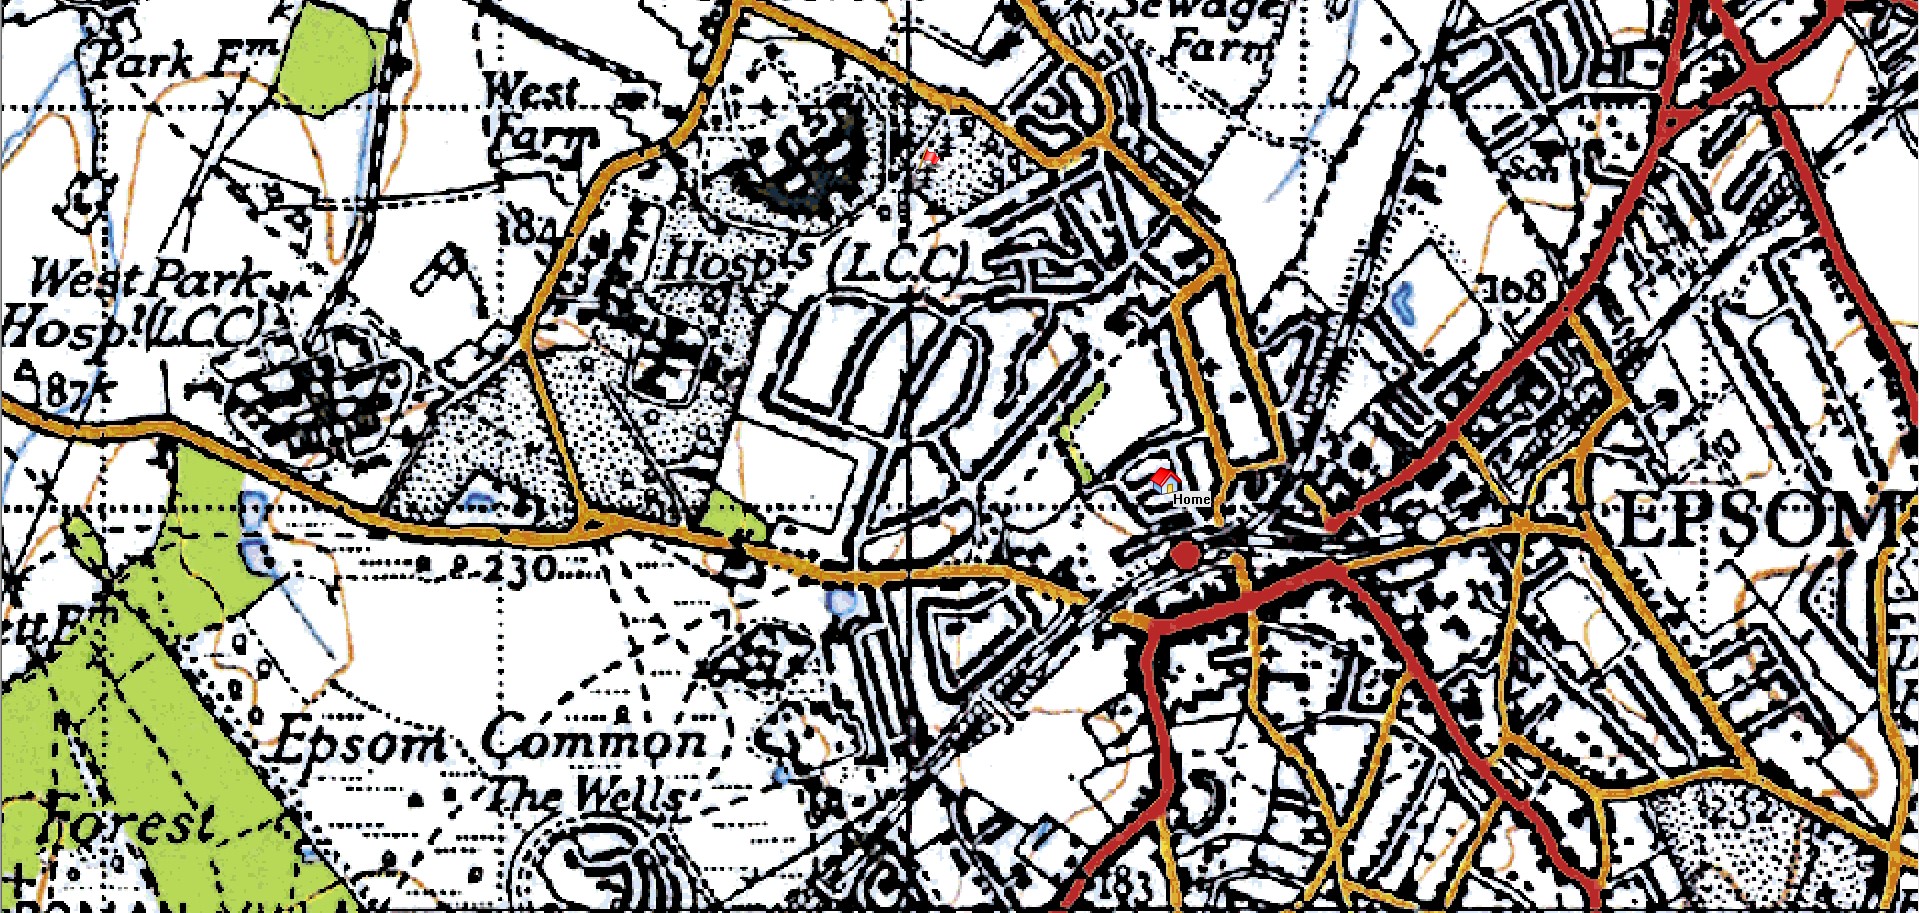 Map 1940s Epsom Court - Extract from Memory Map Historical Maps
National Library of Scotland Ordnance Survey Maps
 OS One Inch NLS South London Outline Sheet 270 Revised 1893 Published 1896
 OS Six Inch NLS Surrey XIX NW Revised 1894 to 1895 Published 1897
 OS 25 NLS Surrey XIX 5 Revised 1912 Published 1913
 OS 1 to 25000 NLS TQ26 Revised 1938 1955 Published 1956
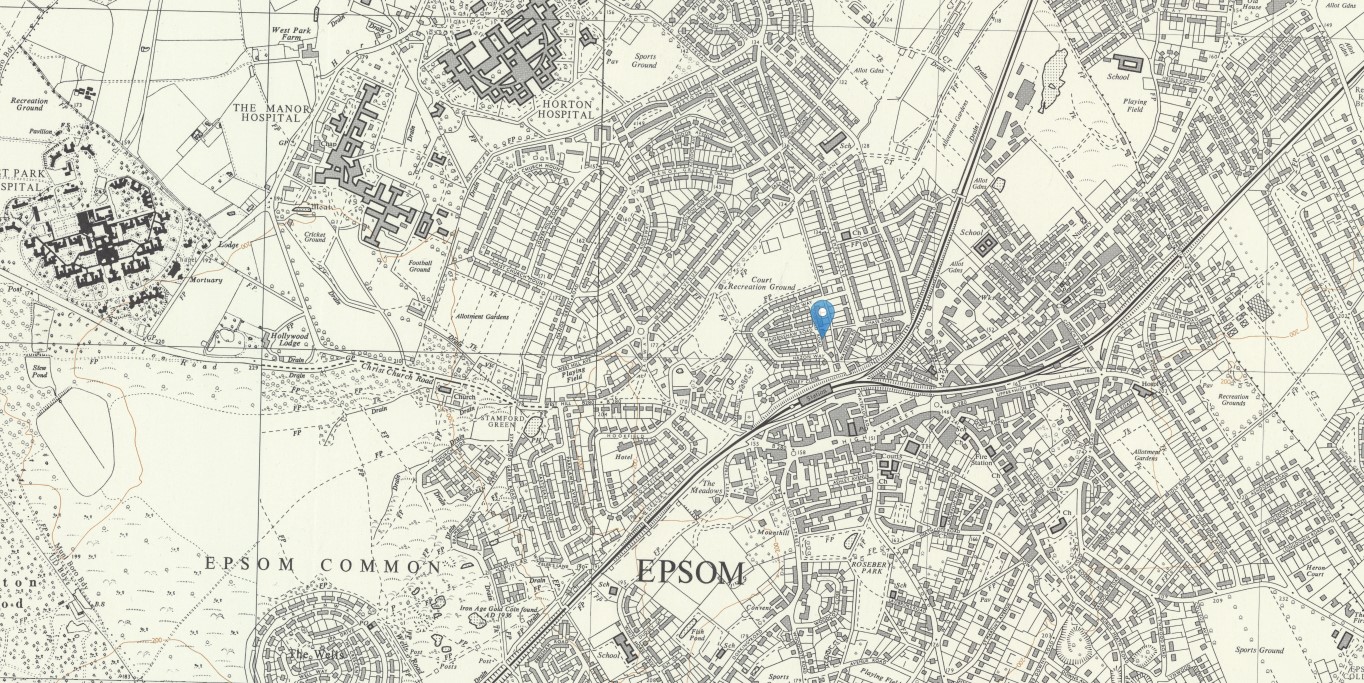 OS 1 to 10560 NLS TQ26SW A Surveyed Revised 1952 to 1961 Published 1962
 OS 1 to 10560 NLS TQ26SW A Surveyed Revised 1952 to 1961 Published 1962 Epsom Court
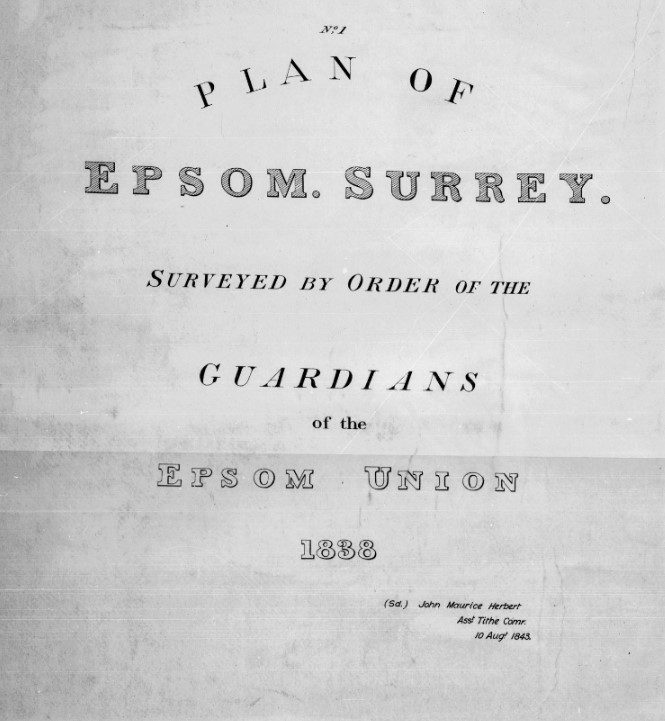
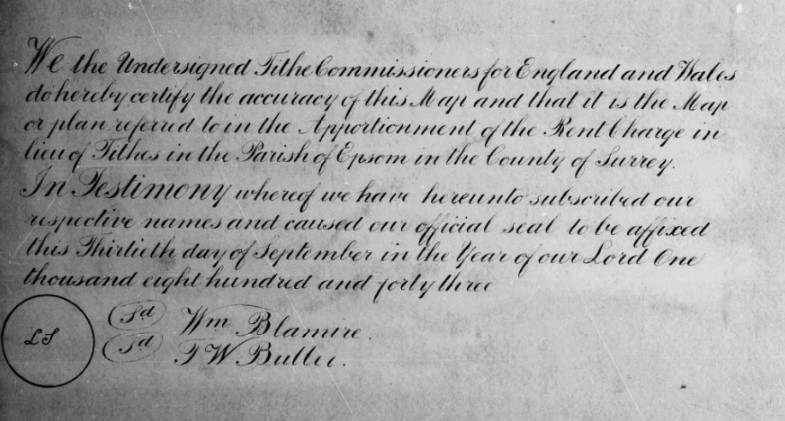
Tithes Apportionment and maps
xxxxx
xxxx
xxxx
xxxxx
| Measure | Equivalent |
|---|---|
| 144 square inches | 1 square foot |
| 9 square feet | 1 square yard |
| 30¼ square yards | 1 perch |
| 40 perches | 1 rood |
| 4 roods | 1 acre |
| 640 acres | 1 square mile |
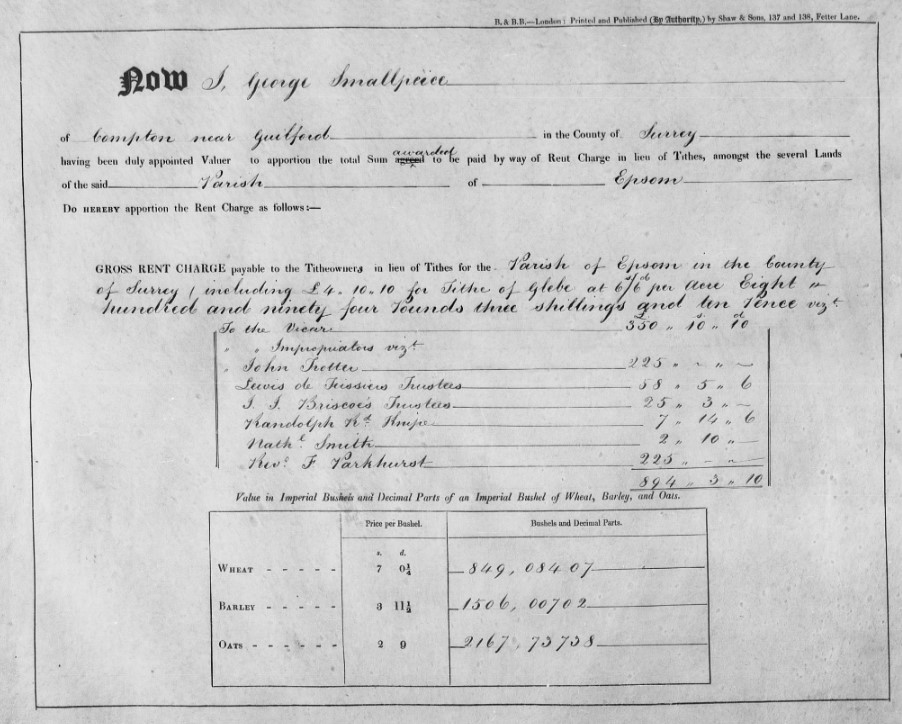
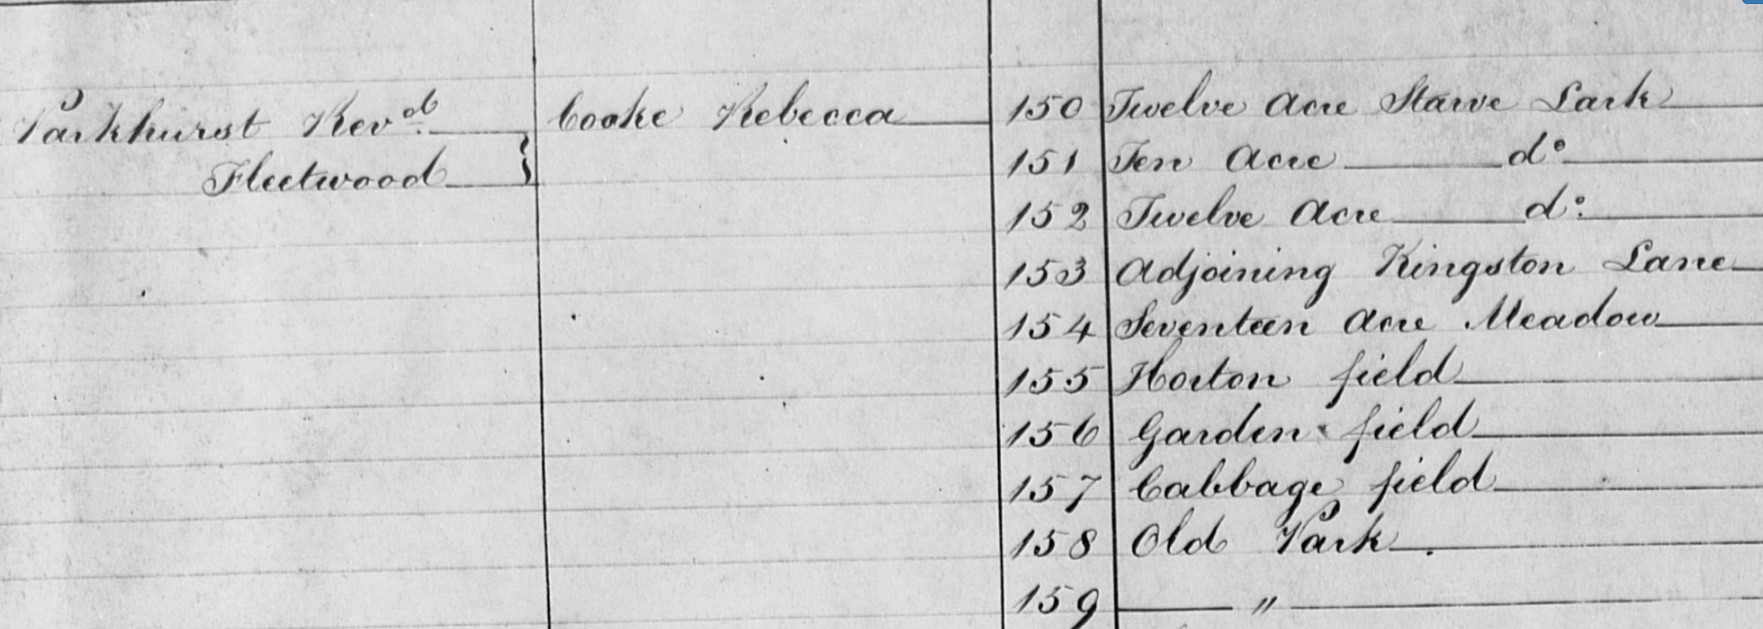
John Trotter is a landowner in Epsom with 1046 acres 3 roods aka roodes 3 perches.
He is also one of the main recipients of the impropriator tithe in the Sum of £225, the same amount as the Rev. R Parkhurst as another impropriator. Each earning about 25% of the total tithe for the parish of Epsom, £894 5s 10p. The relative income value of that income or wealth is £1,014,000.00 in 2020.
The vicar living from the tithe apportionment is £350 10s 10d.
- John Trotter 626a 3r 9p occupied by himself with tithes of £45 2s 3d to the vicar and £121 13s 0d to himself, as the Impropriator.
- Henry Stone 110a 0r 37p with tithes of £7 5s 2d to the vicar and £21 5s 0d to the Impropriator.
- Thomas Whitbourne 309a 2r 37p with tithes of £26 11s 5d to the vicar and £80 0s 0d to the Impropriator.
The Reverend Fleetwood Parkhurst appears not to occupy tithe land in the parish of Epsom, but is recorded as landowner with a number of different occupiers.
- Rebecca Cooke
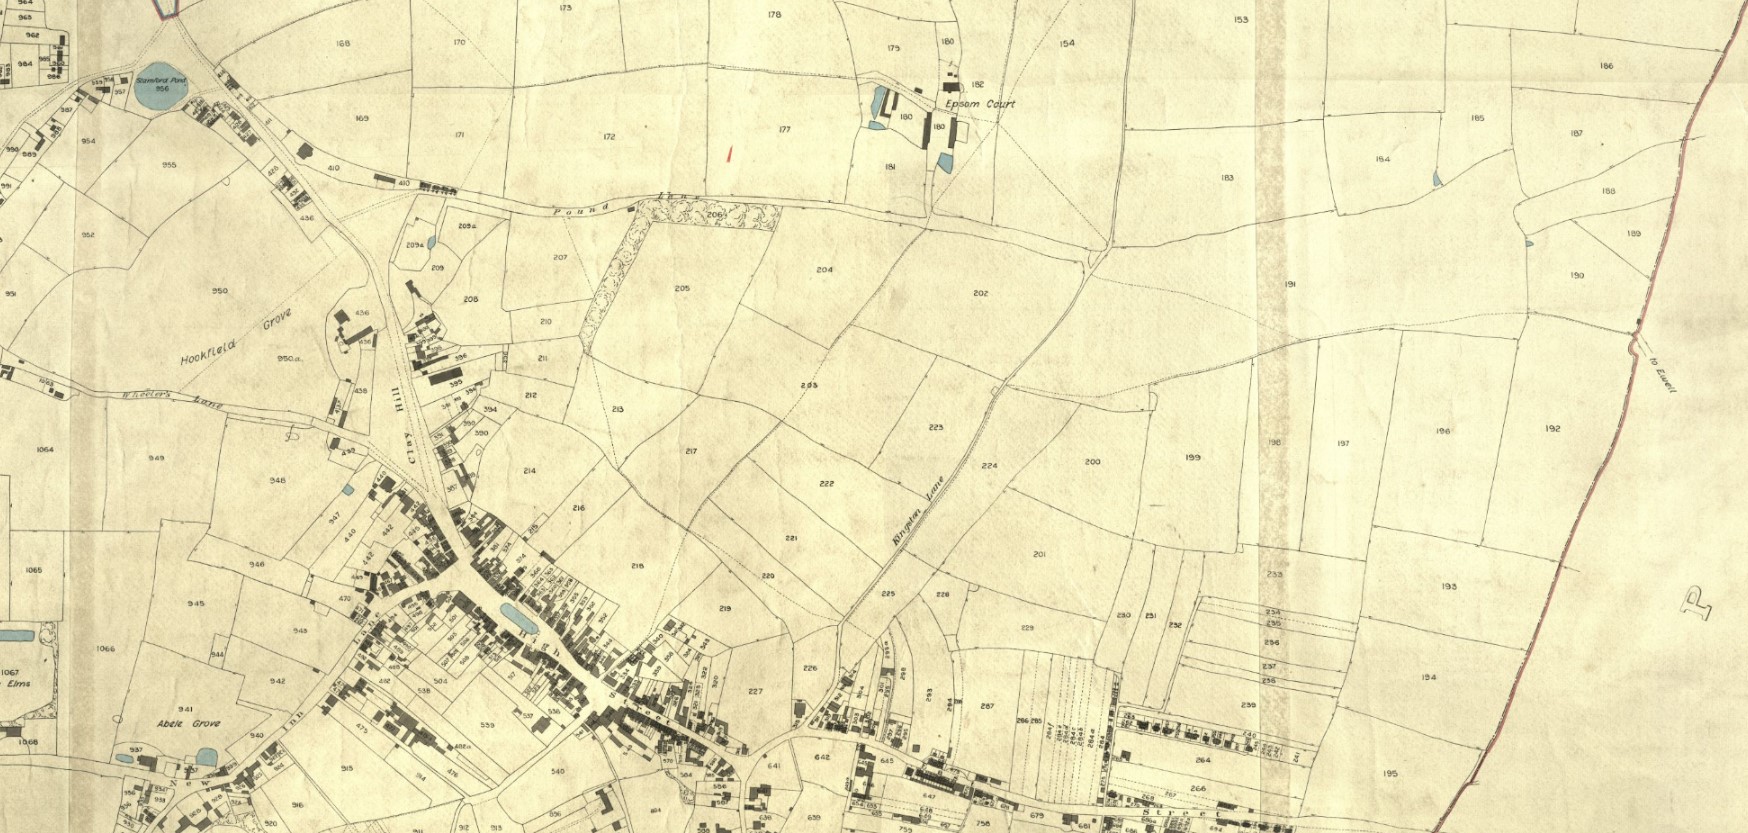
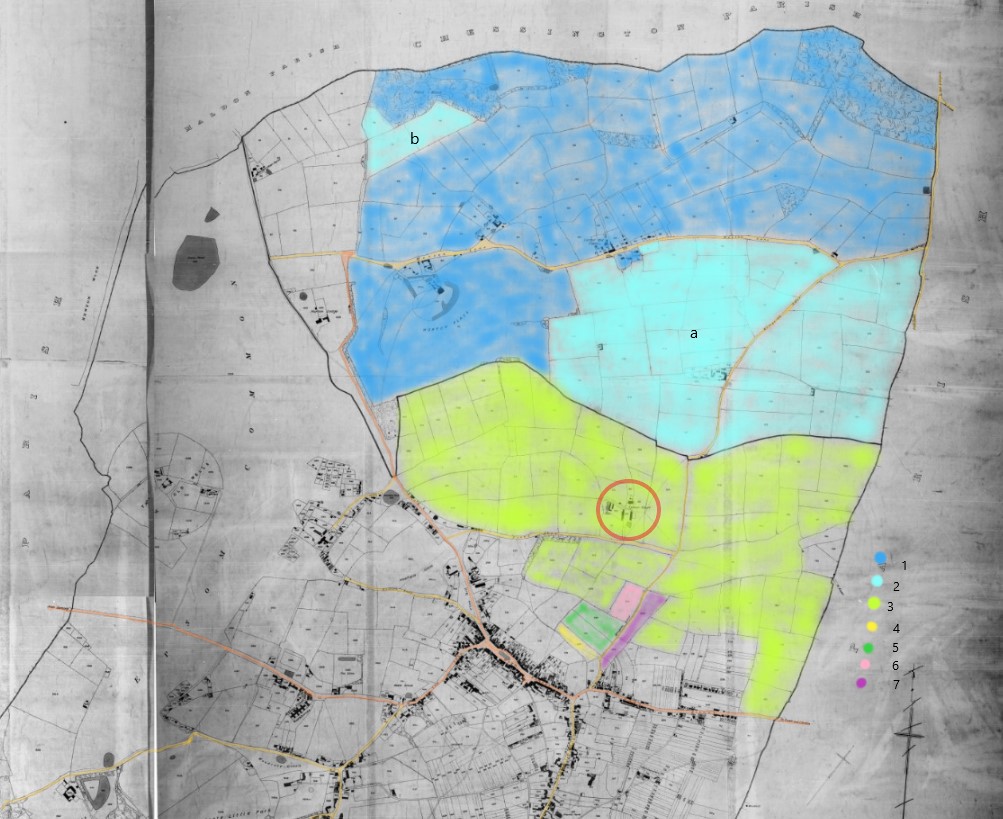
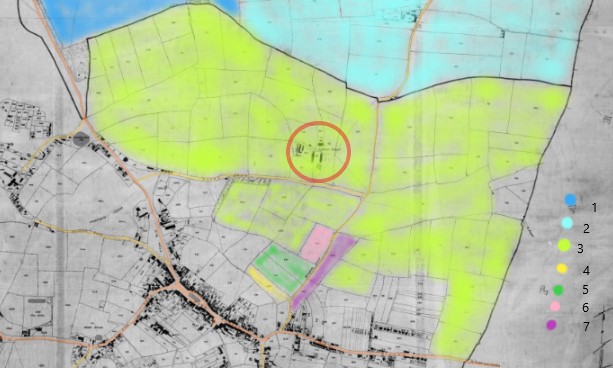
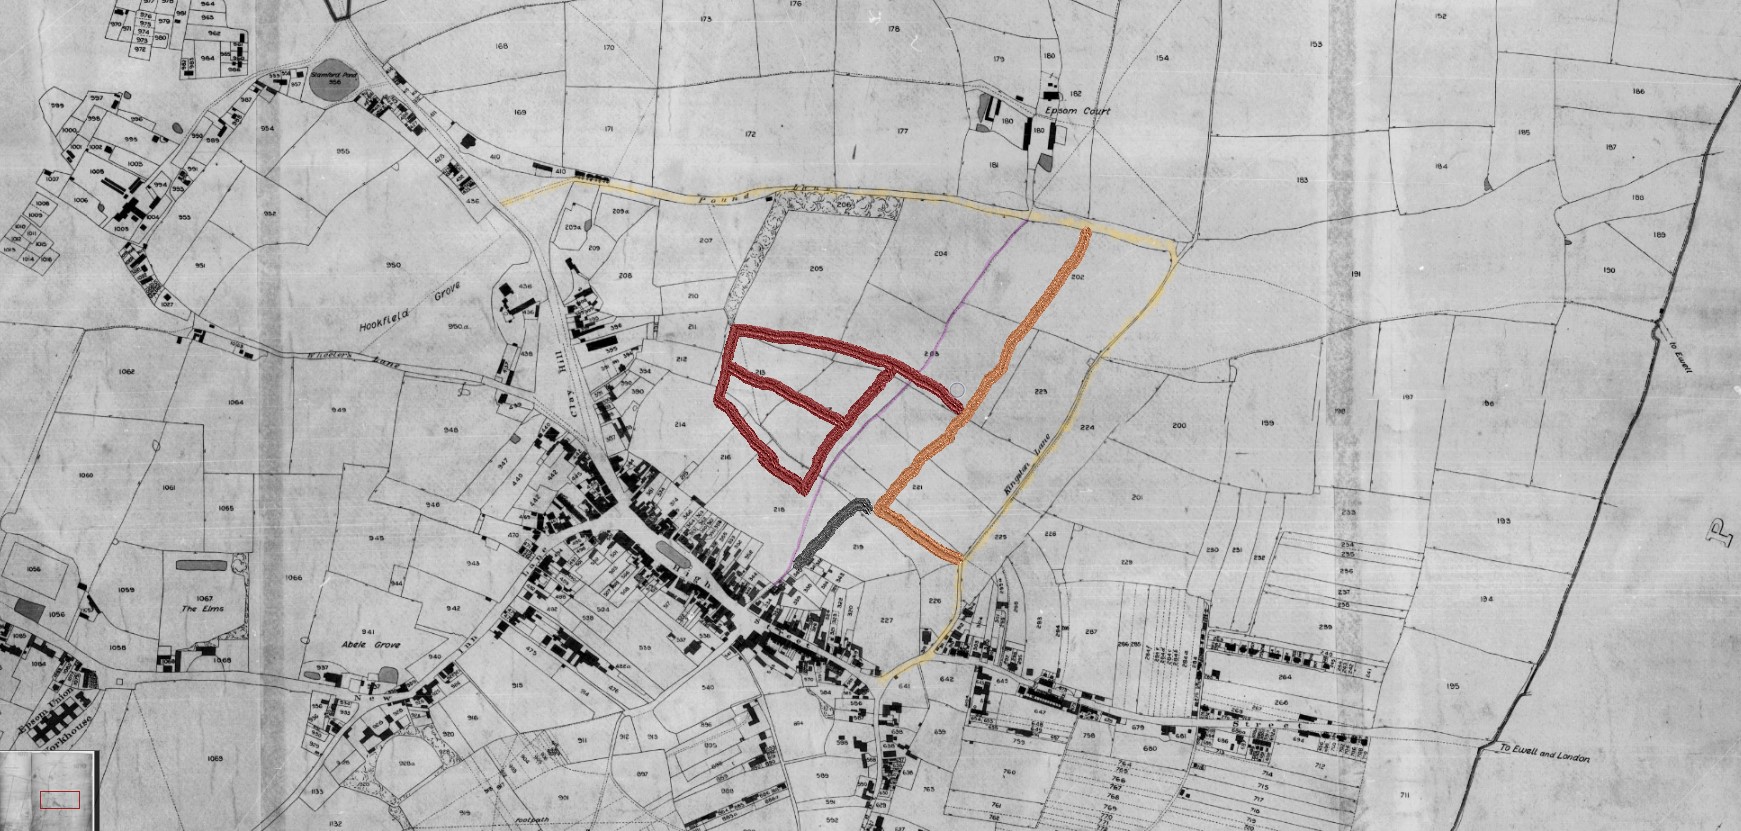
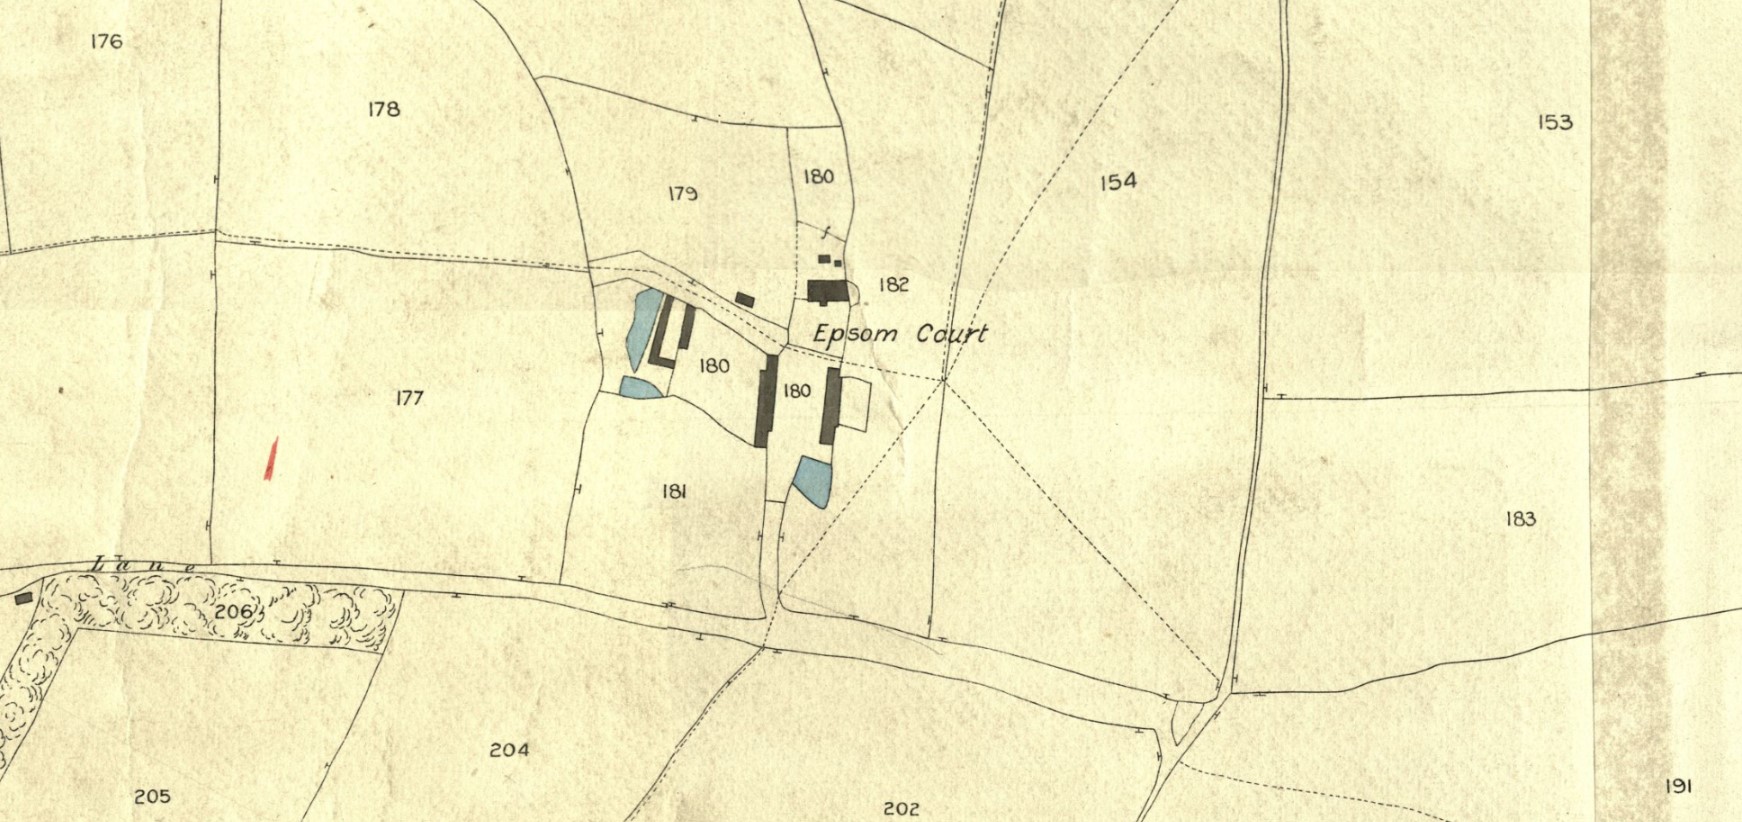
Tithe Map with approximate locations of some of the new roads. Temple road first, in orange. Waterloo road, in grey, under the railway, perhaps to provide a greater hight clearance than the Hook Road bridge, previously known as Kingstone Lane of the tithe map. The estate roads in brown. The locations are only plotted by observation of comparable maps, not properly geolocated. The footprint does appear to exceed the underlining plots or fields.
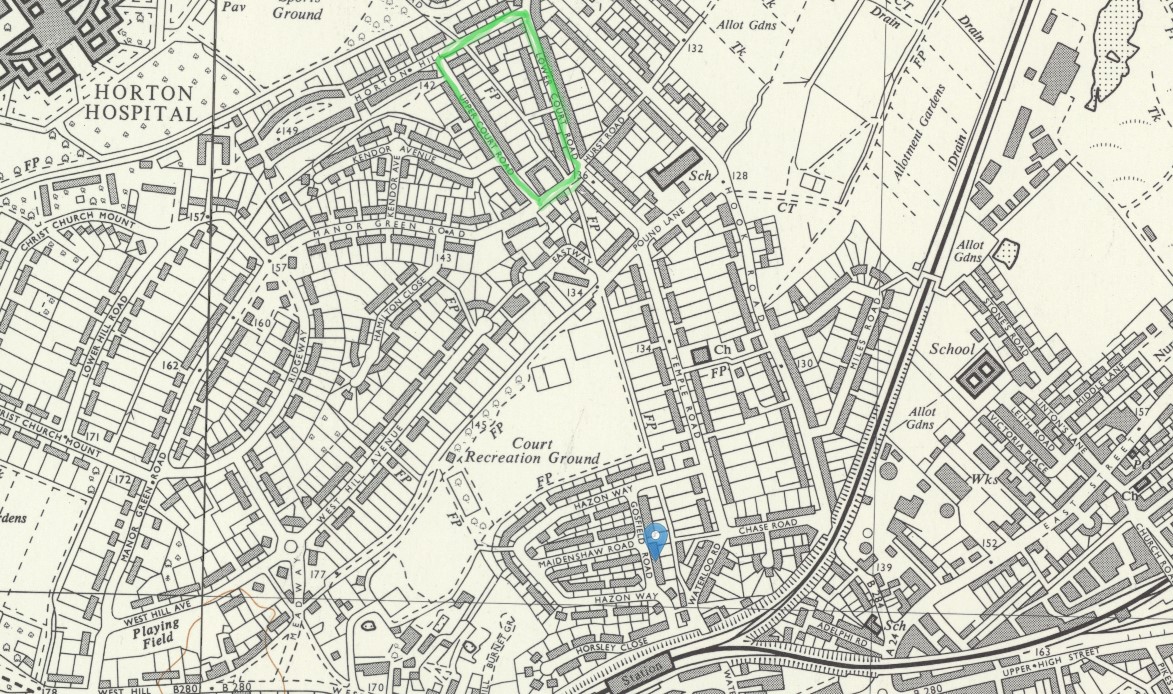
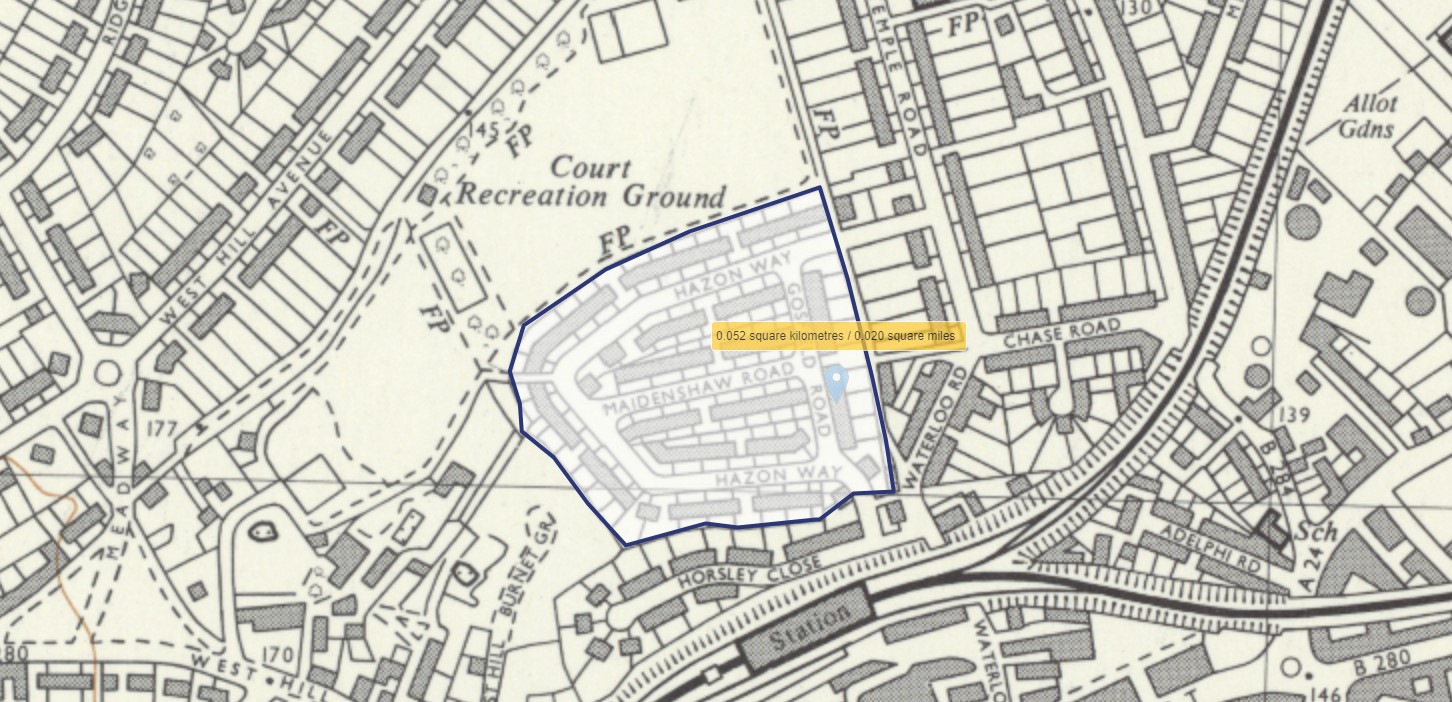 OS 1 to 10560 NLS TQ26SW A Surveyed Revised 1952 to 1961 Published 1962 Court Est
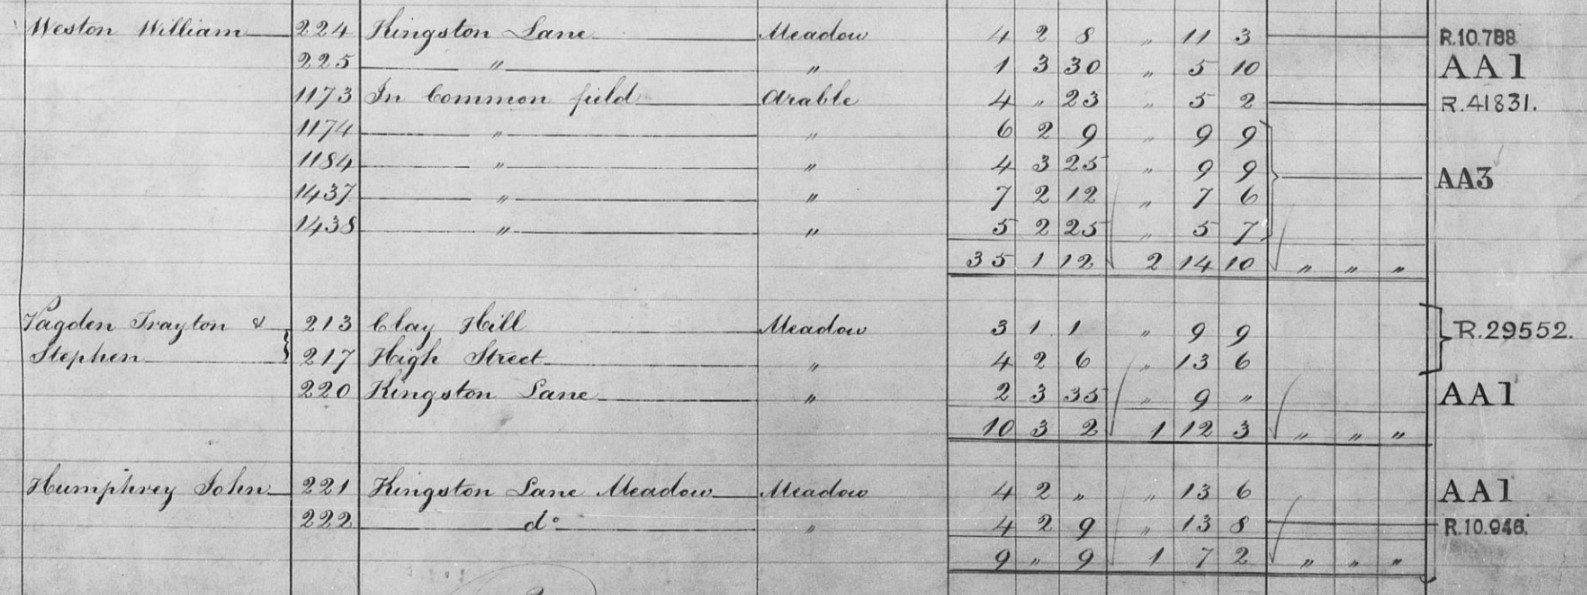
The measured area of the estate is 0.020 Square Miles, which converts to 12.8 Acres. The tithe apportionment for plots 213 and 217 totals 7a 3r 7p. It would be more normal for a development to be built within existing field boundaries.
Go back to the top of this tab in this section
Go to the next tab in this section